| __timestamp | International Business Machines Corporation | Shopify Inc. |
|---|---|---|
| Wednesday, January 1, 2014 | 22472000000 | 57495000 |
| Thursday, January 1, 2015 | 19894000000 | 89105000 |
| Friday, January 1, 2016 | 20279000000 | 172324000 |
| Sunday, January 1, 2017 | 19680000000 | 293413000 |
| Monday, January 1, 2018 | 19366000000 | 457513000 |
| Tuesday, January 1, 2019 | 18724000000 | 651775000 |
| Wednesday, January 1, 2020 | 20561000000 | 847391000 |
| Friday, January 1, 2021 | 18745000000 | 1276401000 |
| Saturday, January 1, 2022 | 17483000000 | 1938255000 |
| Sunday, January 1, 2023 | 17997000000 | 1711000000 |
| Monday, January 1, 2024 | 29536000000 | 1796000000 |
Data in motion
In the ever-evolving landscape of technology giants, the Selling, General, and Administrative (SG&A) expenses of companies like International Business Machines Corporation (IBM) and Shopify Inc. offer a fascinating glimpse into their operational strategies. Over the past decade, IBM's SG&A expenses have shown a steady pattern, peaking in 2024 with a 30% increase from 2023. This reflects IBM's strategic investments in innovation and market expansion.
Conversely, Shopify's SG&A expenses have surged dramatically, growing by over 2,800% from 2014 to 2022, highlighting its aggressive growth strategy and market penetration efforts. However, data for 2024 is missing, leaving room for speculation on Shopify's future financial maneuvers.
These trends underscore the contrasting approaches of a legacy tech giant and a modern e-commerce powerhouse, offering valuable insights into their financial health and strategic priorities.
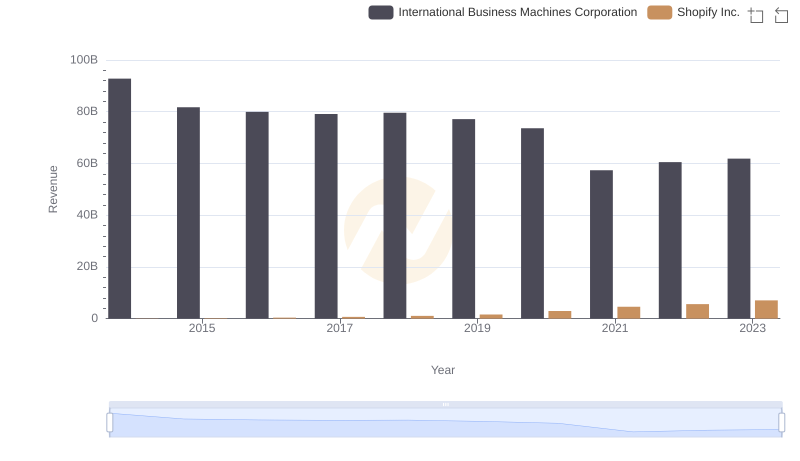
Comparing Revenue Performance: International Business Machines Corporation or Shopify Inc.?
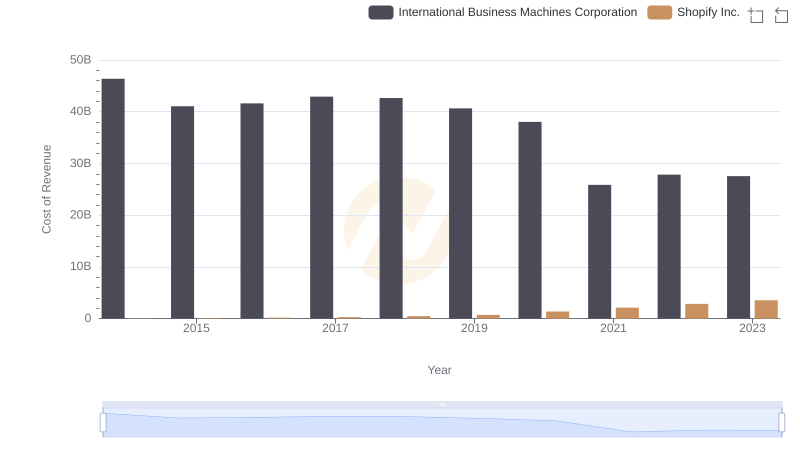
Analyzing Cost of Revenue: International Business Machines Corporation and Shopify Inc.
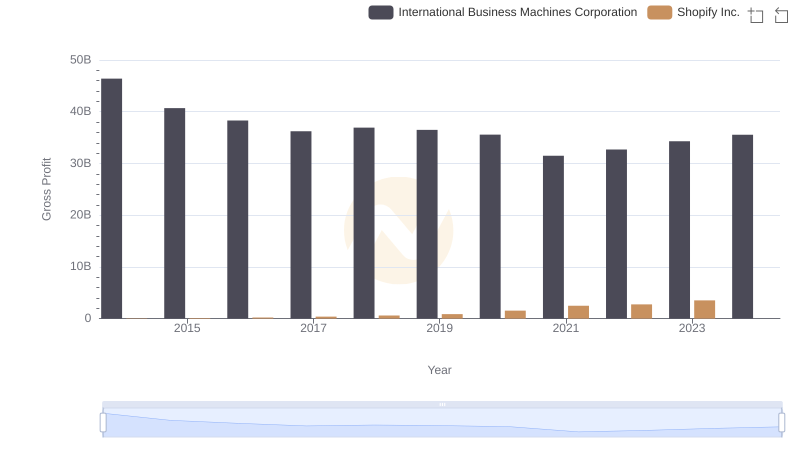
International Business Machines Corporation and Shopify Inc.: A Detailed Gross Profit Analysis
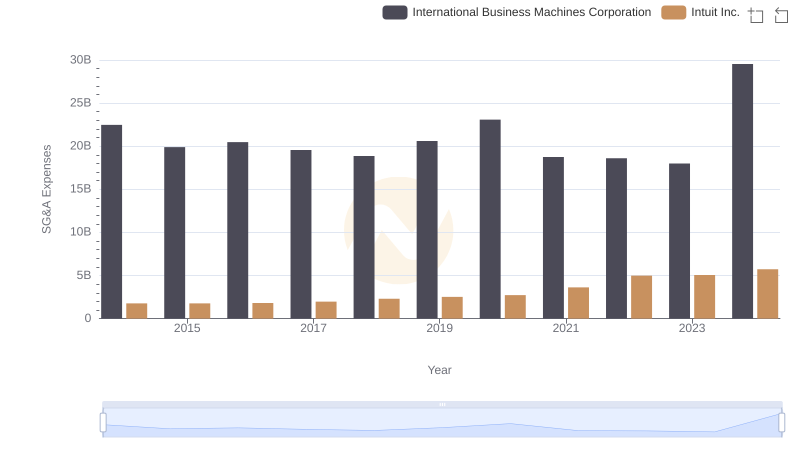
International Business Machines Corporation or Intuit Inc.: Who Manages SG&A Costs Better?
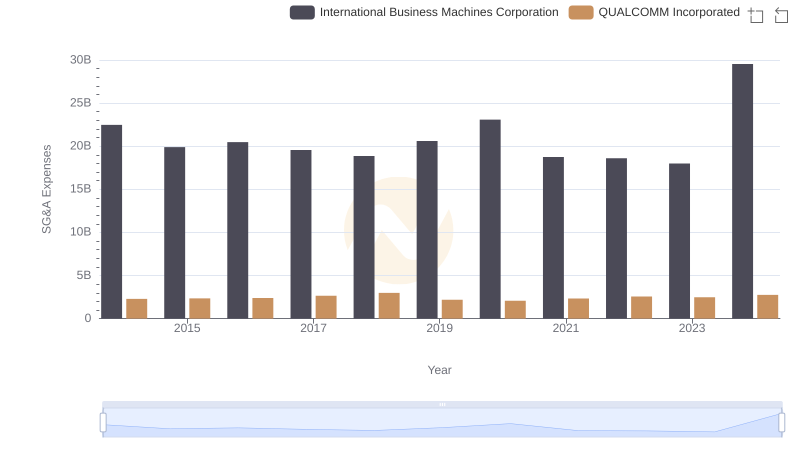
Breaking Down SG&A Expenses: International Business Machines Corporation vs QUALCOMM Incorporated

Analyzing R&D Budgets: International Business Machines Corporation vs Shopify Inc.
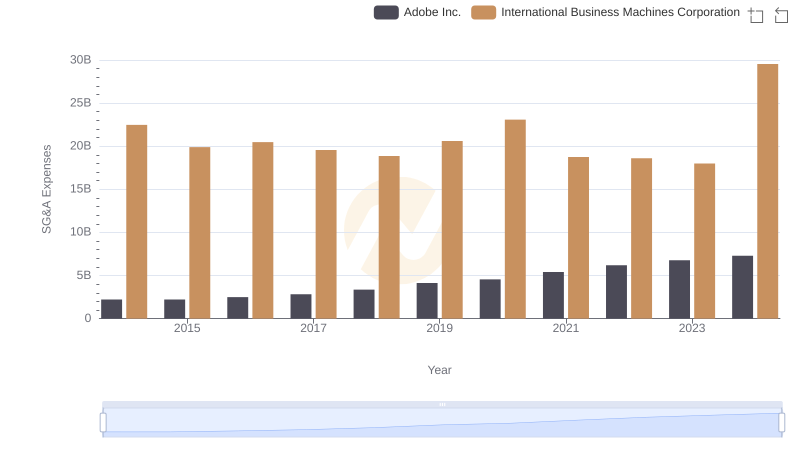
Comparing SG&A Expenses: International Business Machines Corporation vs Adobe Inc. Trends and Insights
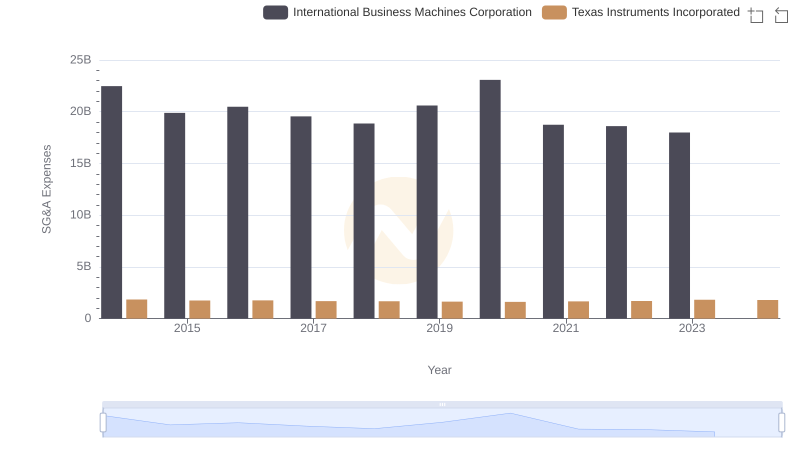
International Business Machines Corporation or Texas Instruments Incorporated: Who Manages SG&A Costs Better?
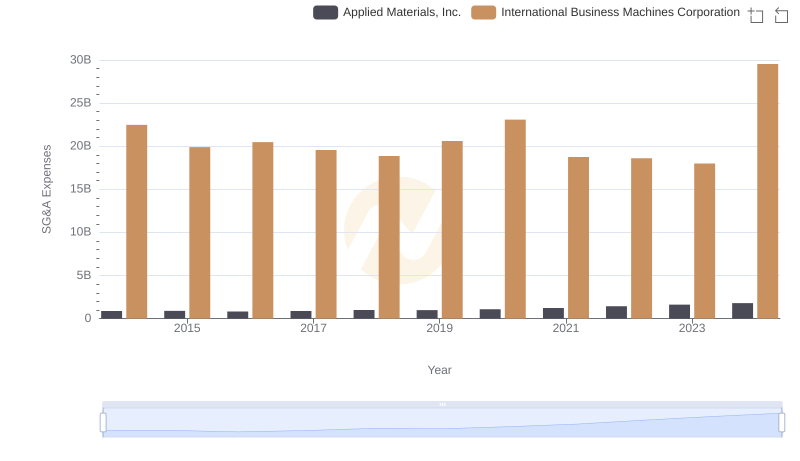
SG&A Efficiency Analysis: Comparing International Business Machines Corporation and Applied Materials, Inc.
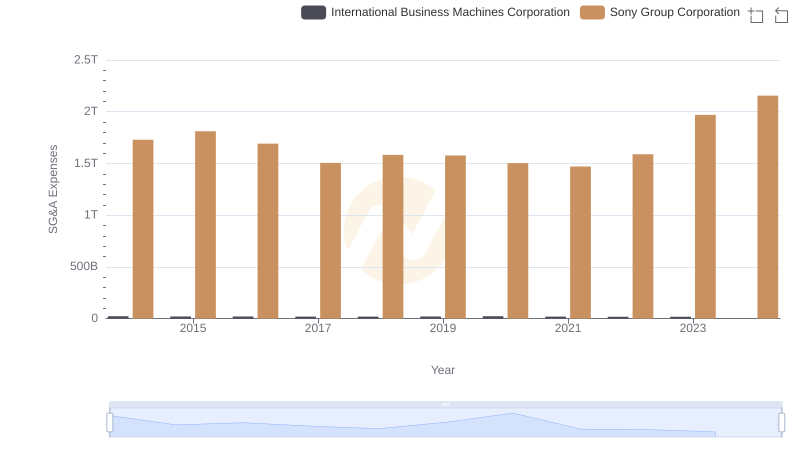
Who Optimizes SG&A Costs Better? International Business Machines Corporation or Sony Group Corporation
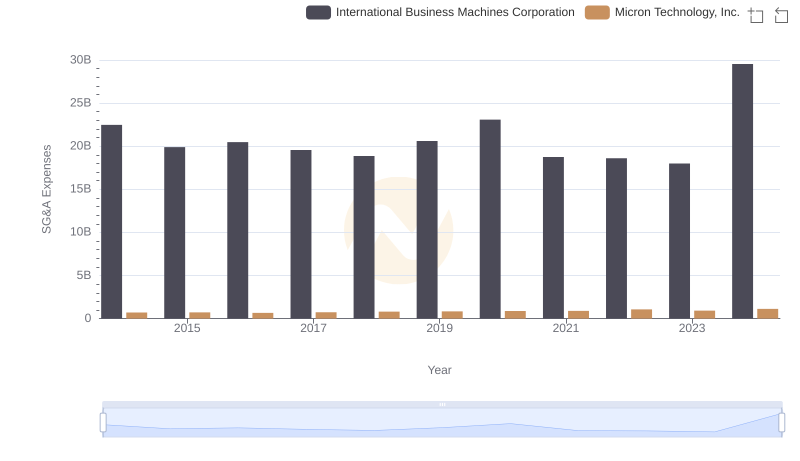
Operational Costs Compared: SG&A Analysis of International Business Machines Corporation and Micron Technology, Inc.