| __timestamp | Corpay, Inc. | Infosys Limited |
|---|---|---|
| Wednesday, January 1, 2014 | 269591000 | 5374000000 |
| Thursday, January 1, 2015 | 439330000 | 5950000000 |
| Friday, January 1, 2016 | 621965000 | 6446000000 |
| Sunday, January 1, 2017 | 756337000 | 7001000000 |
| Monday, January 1, 2018 | 692584000 | 7687000000 |
| Tuesday, January 1, 2019 | 726044000 | 8552000000 |
| Wednesday, January 1, 2020 | 596363000 | 8828000000 |
| Friday, January 1, 2021 | 559819000 | 10996000000 |
| Saturday, January 1, 2022 | 764707000 | 12709000000 |
| Sunday, January 1, 2023 | 819908000 | 13096000000 |
| Monday, January 1, 2024 | 0 |
Unveiling the hidden dimensions of data
In the ever-evolving landscape of global business, understanding the cost of revenue is crucial for evaluating a company's financial health. This analysis focuses on Infosys Limited and Corpay, Inc., two giants in their respective fields. Over the past decade, Infosys has consistently outpaced Corpay in terms of cost of revenue, with figures peaking at approximately $13 billion in 2023, a 143% increase from 2014. In contrast, Corpay's cost of revenue grew by 204% over the same period, reaching around $820 million in 2023. This disparity highlights the scale and operational differences between the two companies. While Infosys's growth reflects its expansive global operations, Corpay's rapid percentage increase suggests aggressive scaling strategies. As we move forward, these trends offer valuable insights into the strategic priorities and market positioning of these industry leaders.
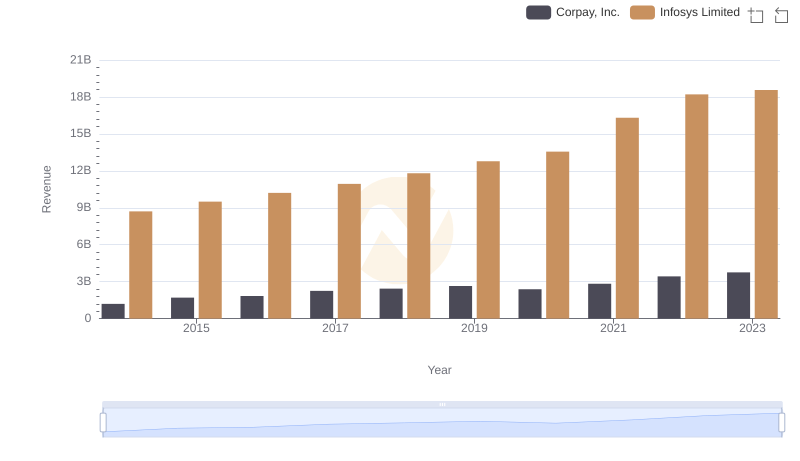
Revenue Showdown: Infosys Limited vs Corpay, Inc.
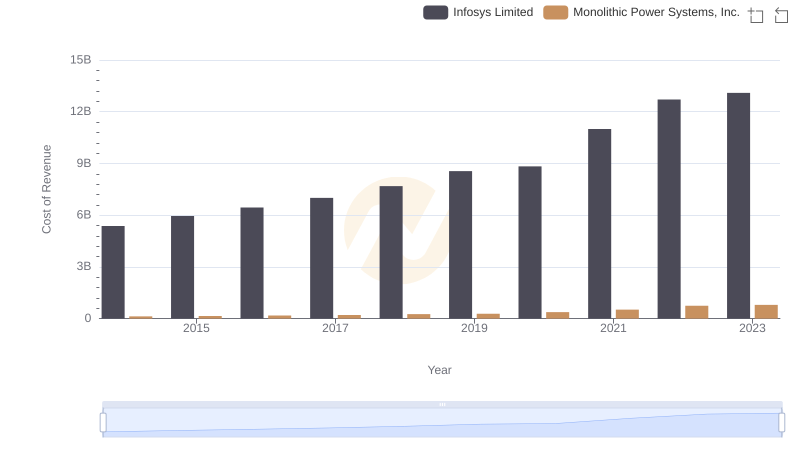
Analyzing Cost of Revenue: Infosys Limited and Monolithic Power Systems, Inc.
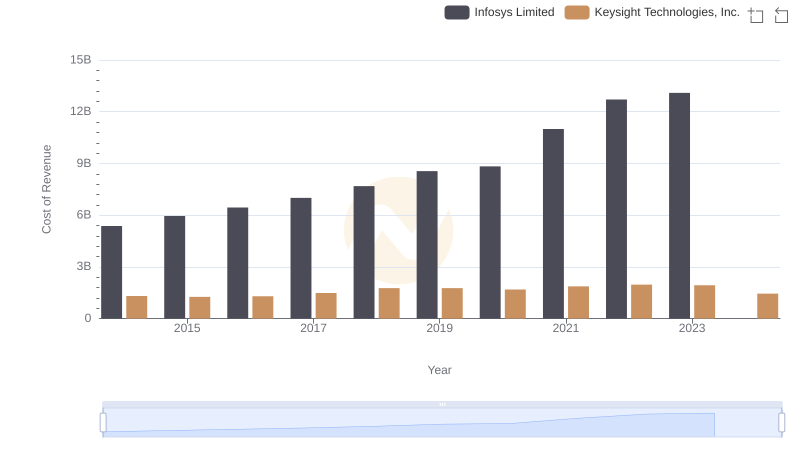
Cost Insights: Breaking Down Infosys Limited and Keysight Technologies, Inc.'s Expenses
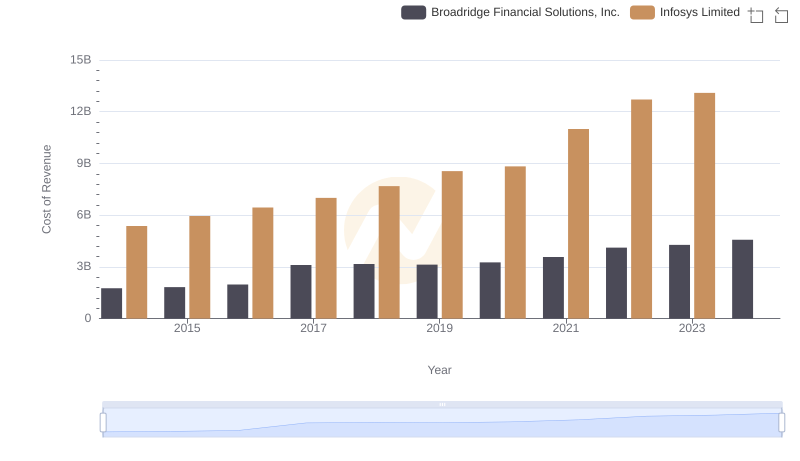
Comparing Cost of Revenue Efficiency: Infosys Limited vs Broadridge Financial Solutions, Inc.
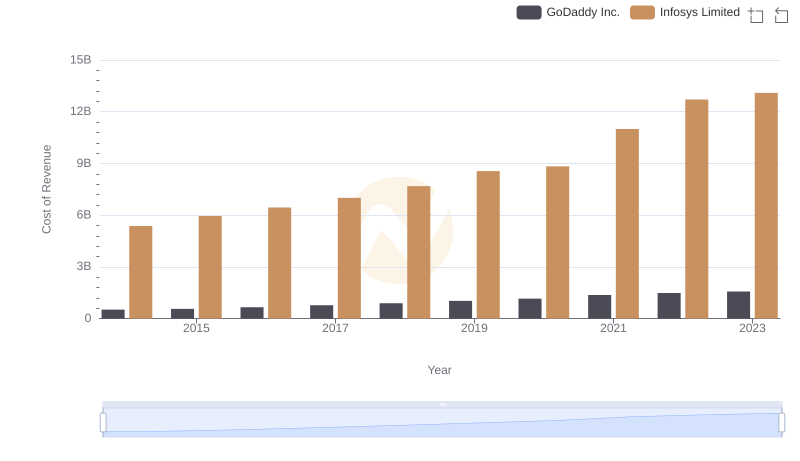
Cost of Revenue: Key Insights for Infosys Limited and GoDaddy Inc.
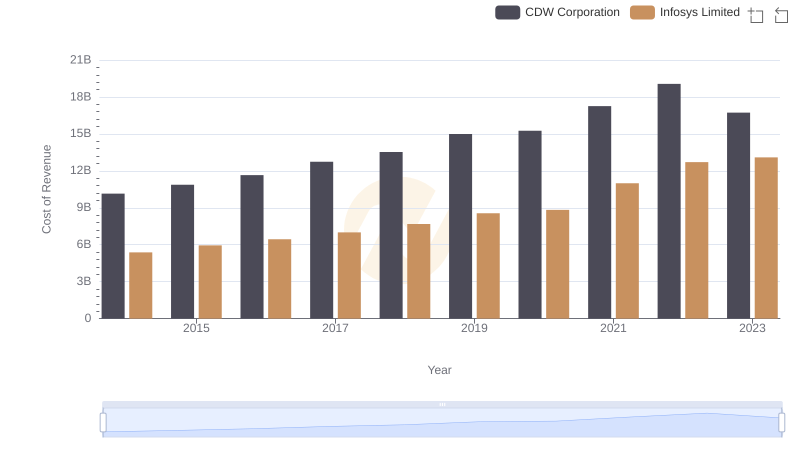
Cost of Revenue: Key Insights for Infosys Limited and CDW Corporation
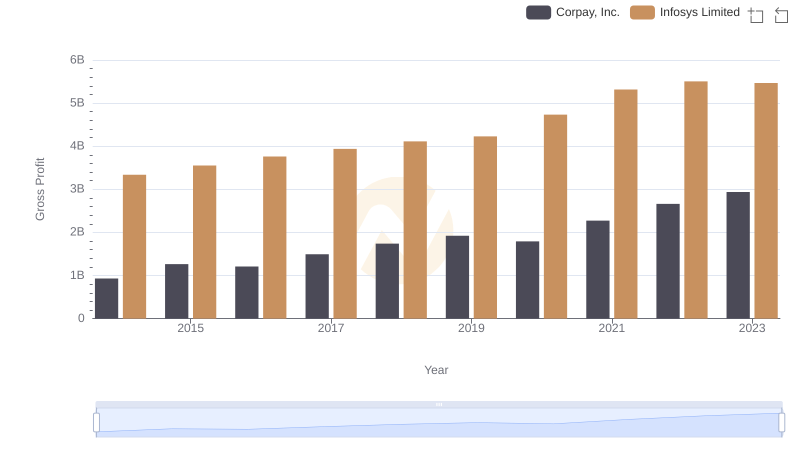
Gross Profit Analysis: Comparing Infosys Limited and Corpay, Inc.
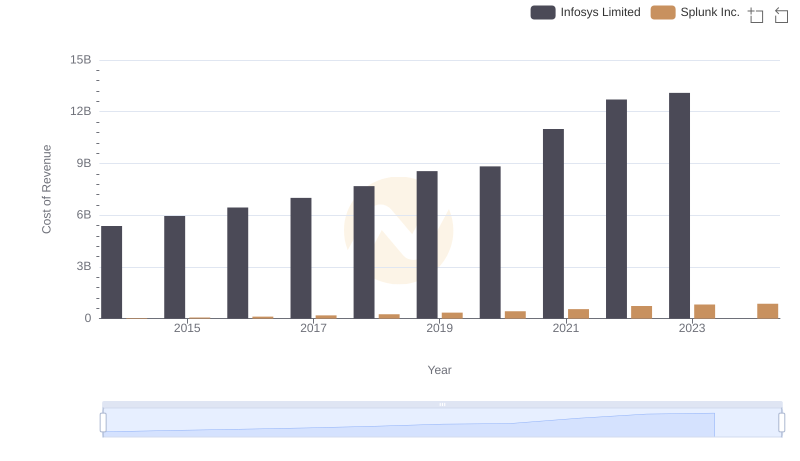
Infosys Limited vs Splunk Inc.: Efficiency in Cost of Revenue Explored
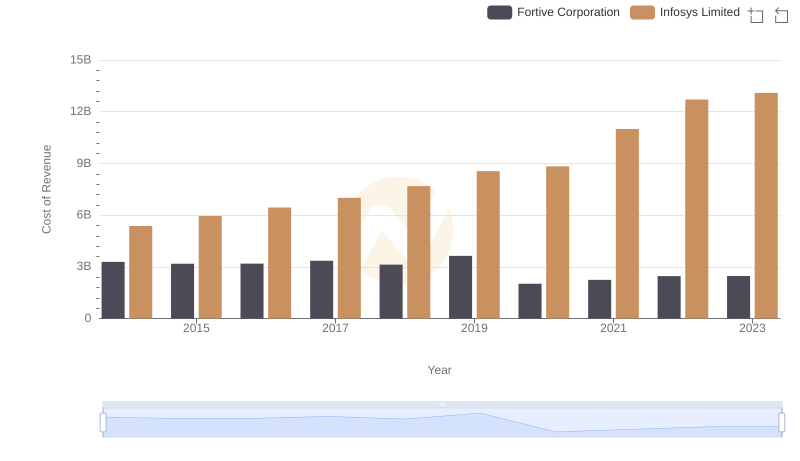
Comparing Cost of Revenue Efficiency: Infosys Limited vs Fortive Corporation
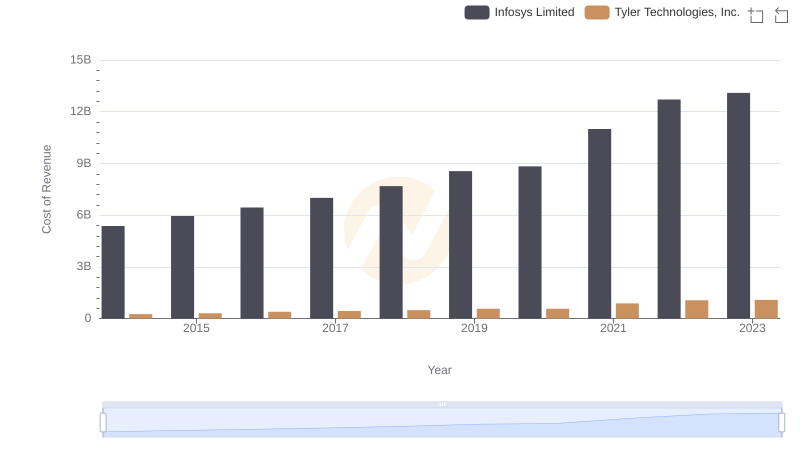
Cost of Revenue: Key Insights for Infosys Limited and Tyler Technologies, Inc.
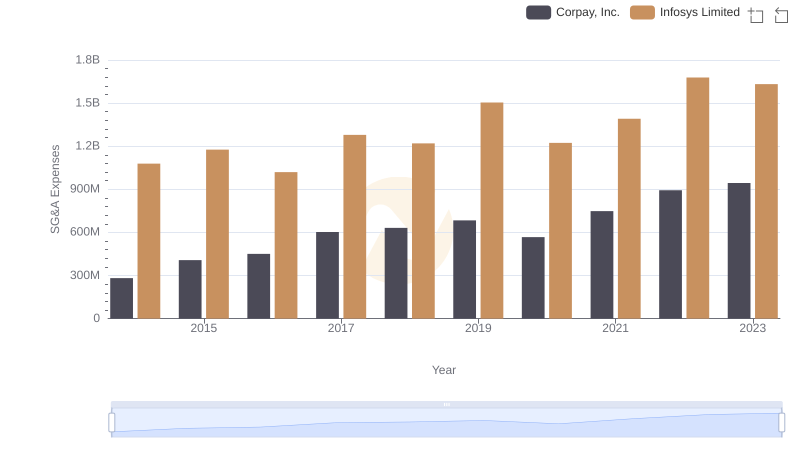
Comparing SG&A Expenses: Infosys Limited vs Corpay, Inc. Trends and Insights
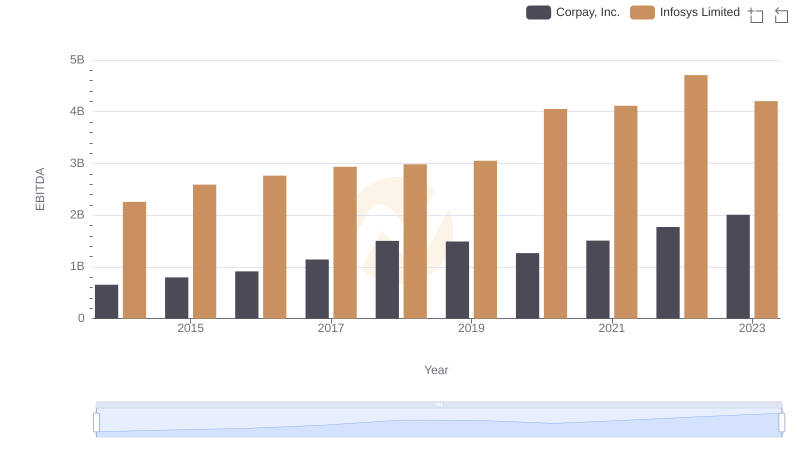
Infosys Limited and Corpay, Inc.: A Detailed Examination of EBITDA Performance