| __timestamp | ANSYS, Inc. | Infosys Limited |
|---|---|---|
| Wednesday, January 1, 2014 | 782635000 | 3337000000 |
| Thursday, January 1, 2015 | 795507000 | 3551000000 |
| Friday, January 1, 2016 | 841605000 | 3762000000 |
| Sunday, January 1, 2017 | 945086000 | 3938000000 |
| Monday, January 1, 2018 | 1137751000 | 4112000000 |
| Tuesday, January 1, 2019 | 1349619000 | 4228000000 |
| Wednesday, January 1, 2020 | 1456033000 | 4733000000 |
| Friday, January 1, 2021 | 1648731000 | 5315000000 |
| Saturday, January 1, 2022 | 1814912000 | 5503000000 |
| Sunday, January 1, 2023 | 1998651000 | 5466000000 |
| Monday, January 1, 2024 | 2264990000 |
Unleashing insights
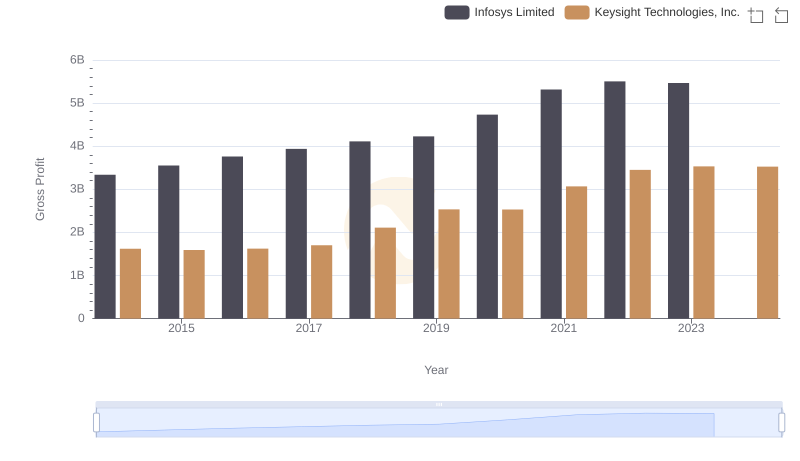
In the ever-evolving landscape of global technology, the financial performance of industry giants like Infosys Limited and ANSYS, Inc. offers a fascinating glimpse into their strategic prowess. Over the past decade, from 2014 to 2023, Infosys Limited has consistently outperformed ANSYS, Inc. in terms of gross profit. Starting at approximately 3.3 billion in 2014, Infosys saw a robust growth of around 64%, reaching nearly 5.5 billion by 2022. In contrast, ANSYS, Inc. began with a gross profit of about 783 million in 2014, experiencing a remarkable increase of 155% to approximately 2 billion by 2023.
This data highlights the dynamic growth trajectories of these two tech titans, with Infosys maintaining a steady lead. As the digital transformation accelerates, these insights underscore the importance of strategic innovation and market adaptation in sustaining financial growth.
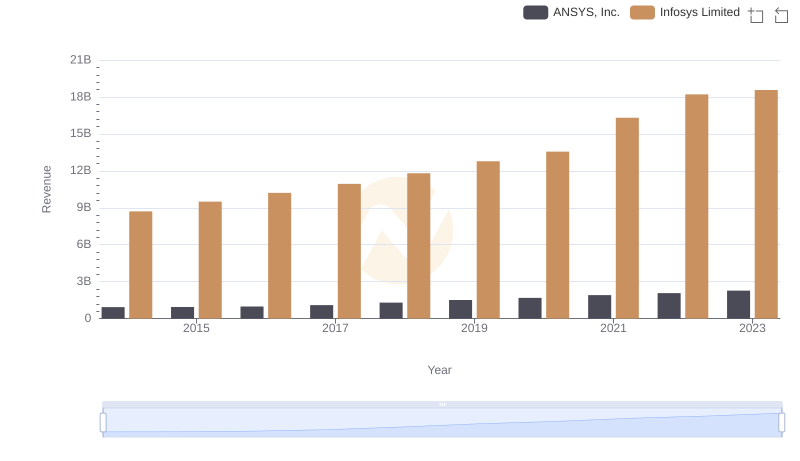
Infosys Limited or ANSYS, Inc.: Who Leads in Yearly Revenue?
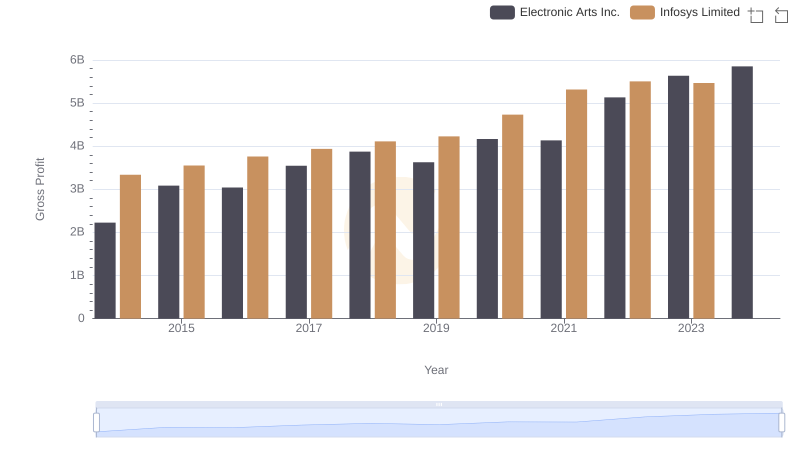
Who Generates Higher Gross Profit? Infosys Limited or Electronic Arts Inc.
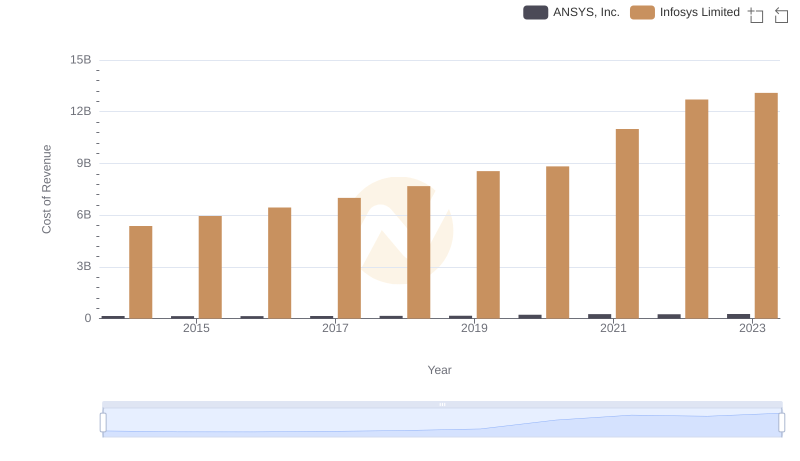
Cost of Revenue Trends: Infosys Limited vs ANSYS, Inc.
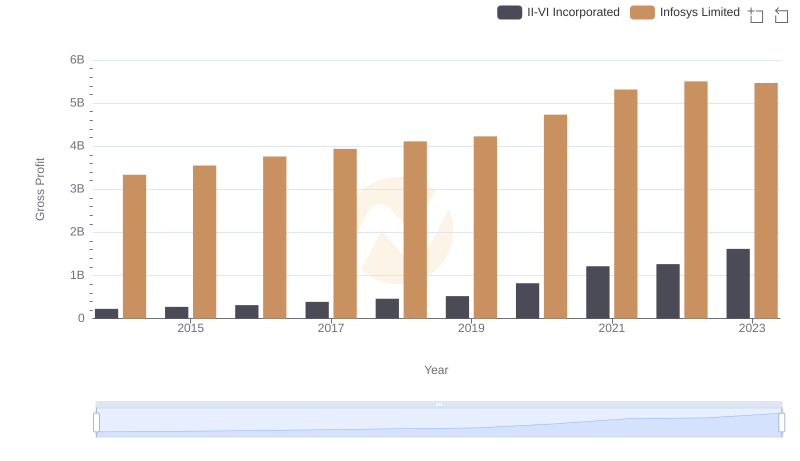
Key Insights on Gross Profit: Infosys Limited vs II-VI Incorporated
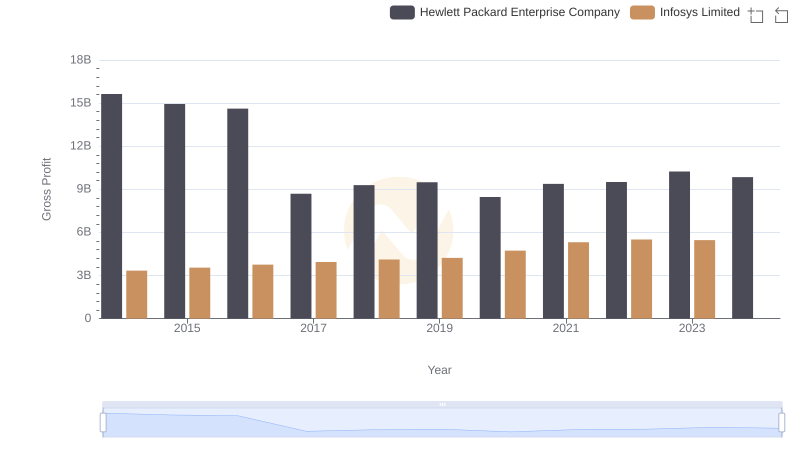
Gross Profit Trends Compared: Infosys Limited vs Hewlett Packard Enterprise Company
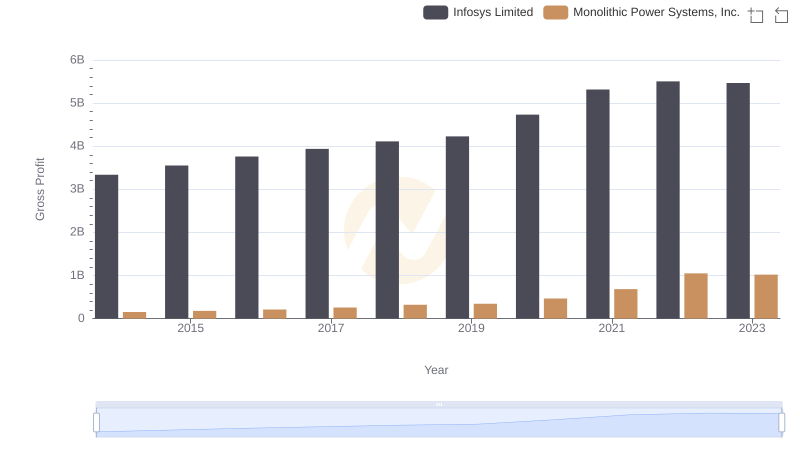
Infosys Limited and Monolithic Power Systems, Inc.: A Detailed Gross Profit Analysis
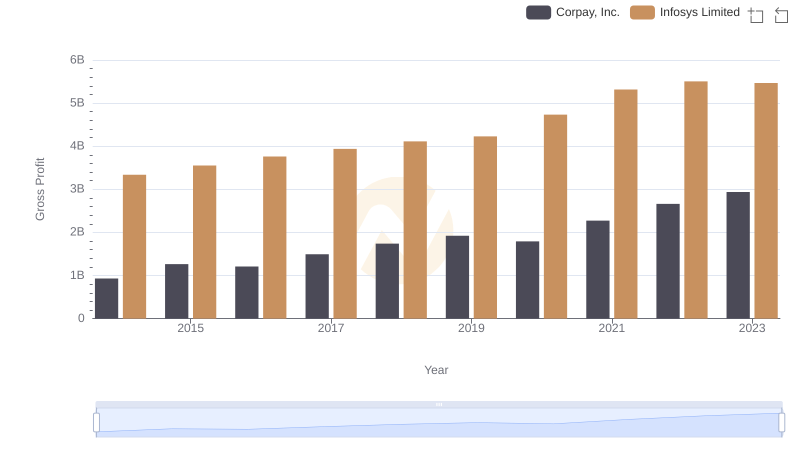
Gross Profit Analysis: Comparing Infosys Limited and Corpay, Inc.
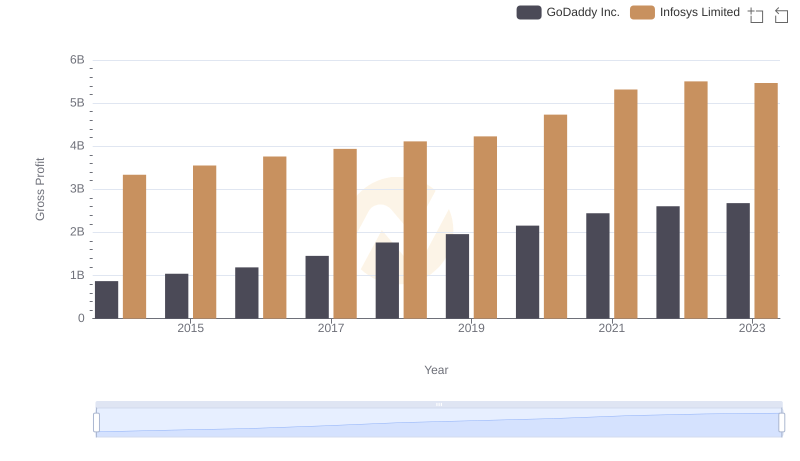
Gross Profit Trends Compared: Infosys Limited vs GoDaddy Inc.
Gross Profit Comparison: Infosys Limited and Keysight Technologies, Inc. Trends
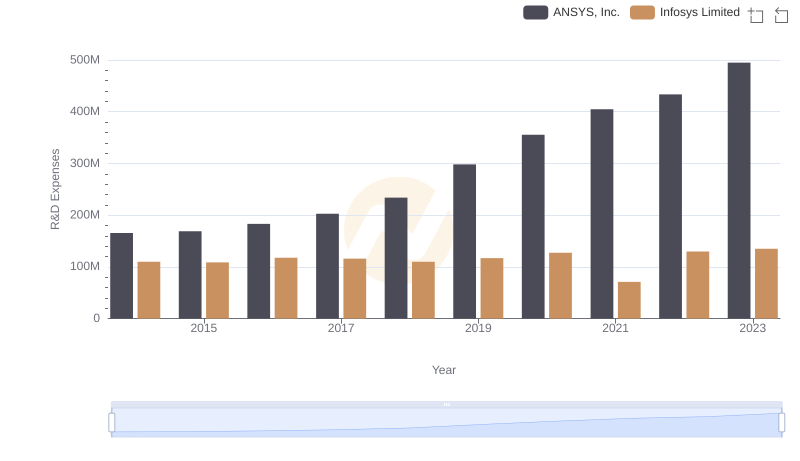
Who Prioritizes Innovation? R&D Spending Compared for Infosys Limited and ANSYS, Inc.
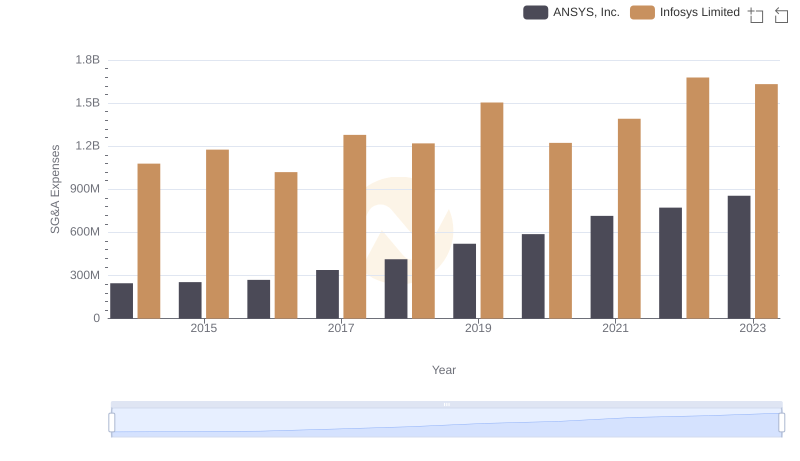
Comparing SG&A Expenses: Infosys Limited vs ANSYS, Inc. Trends and Insights
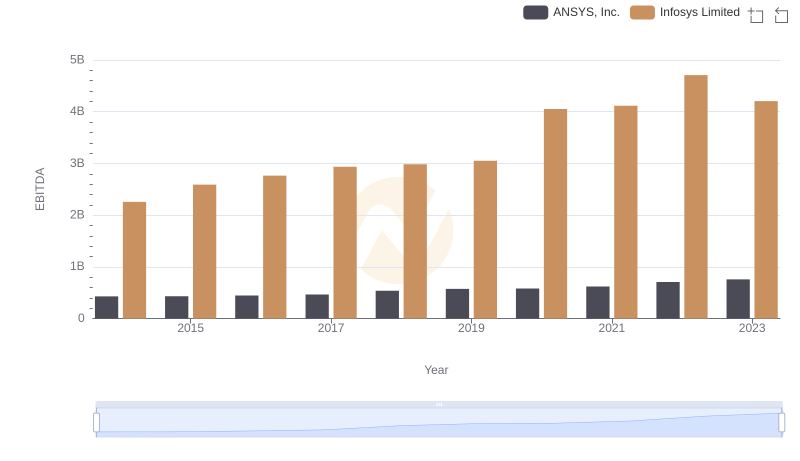
EBITDA Performance Review: Infosys Limited vs ANSYS, Inc.