| __timestamp | ANSYS, Inc. | Infosys Limited |
|---|---|---|
| Wednesday, January 1, 2014 | 430474000 | 2258000000 |
| Thursday, January 1, 2015 | 431349000 | 2590000000 |
| Friday, January 1, 2016 | 445829000 | 2765000000 |
| Sunday, January 1, 2017 | 466306000 | 2936000000 |
| Monday, January 1, 2018 | 539355000 | 2984000000 |
| Tuesday, January 1, 2019 | 575556000 | 3053000000 |
| Wednesday, January 1, 2020 | 581631000 | 4053342784 |
| Friday, January 1, 2021 | 620138000 | 4116000000 |
| Saturday, January 1, 2022 | 707221000 | 4707334610 |
| Sunday, January 1, 2023 | 758639000 | 4206000000 |
| Monday, January 1, 2024 | 717888000 |
In pursuit of knowledge
In the ever-evolving landscape of global technology, the financial performance of industry giants like Infosys Limited and ANSYS, Inc. offers a fascinating glimpse into their strategic prowess. Over the past decade, Infosys has consistently outperformed ANSYS in terms of EBITDA, showcasing a robust growth trajectory. From 2014 to 2023, Infosys's EBITDA surged by approximately 86%, reflecting its strong market position and operational efficiency. In contrast, ANSYS experienced a commendable 76% increase, underscoring its resilience and adaptability in a competitive environment.
The year 2020 marked a significant leap for Infosys, with a 33% jump in EBITDA, coinciding with a global shift towards digital transformation. Meanwhile, ANSYS's steady growth trajectory highlights its commitment to innovation and customer-centric solutions. As we look to the future, these trends underscore the dynamic nature of the tech industry and the strategic maneuvers that define its leaders.
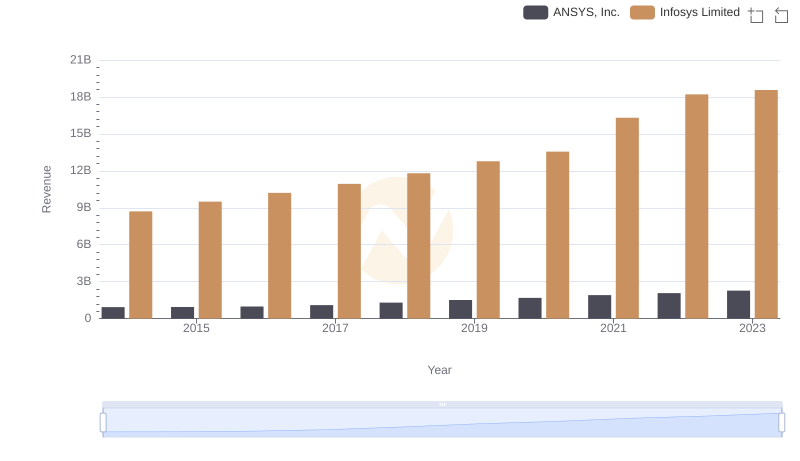
Infosys Limited or ANSYS, Inc.: Who Leads in Yearly Revenue?
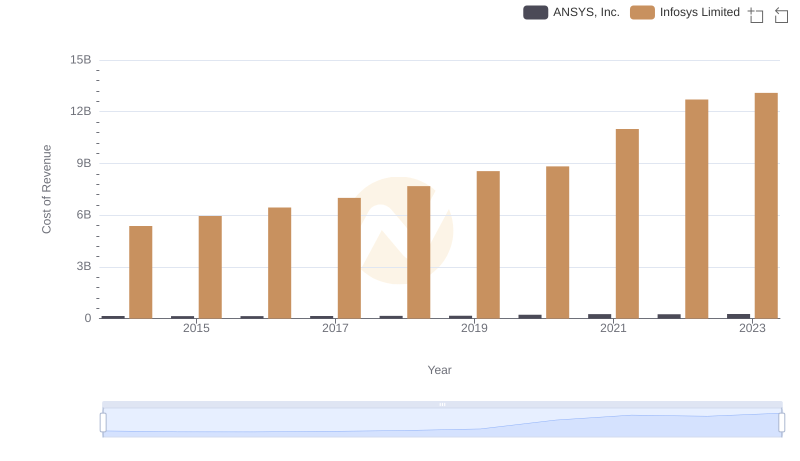
Cost of Revenue Trends: Infosys Limited vs ANSYS, Inc.
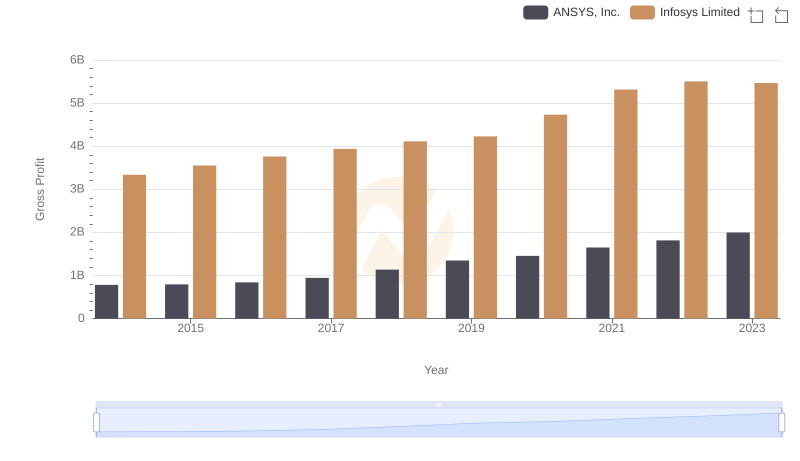
Key Insights on Gross Profit: Infosys Limited vs ANSYS, Inc.
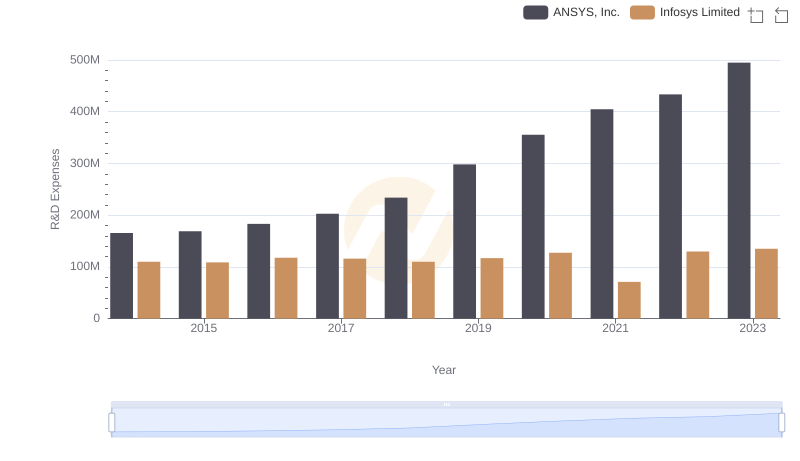
Who Prioritizes Innovation? R&D Spending Compared for Infosys Limited and ANSYS, Inc.
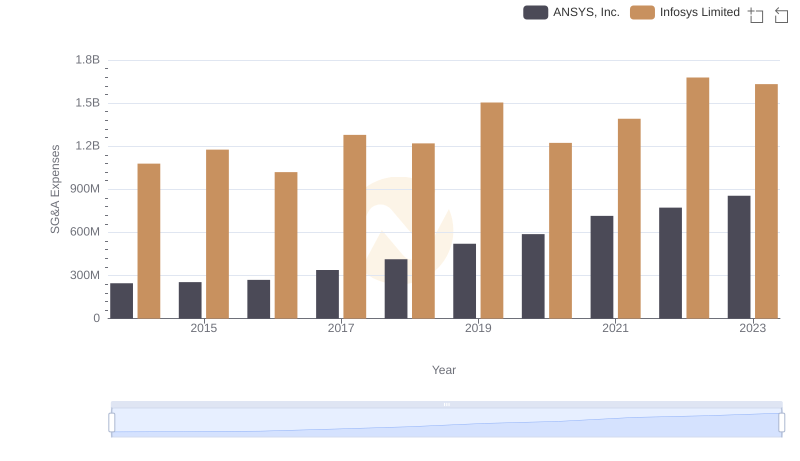
Comparing SG&A Expenses: Infosys Limited vs ANSYS, Inc. Trends and Insights
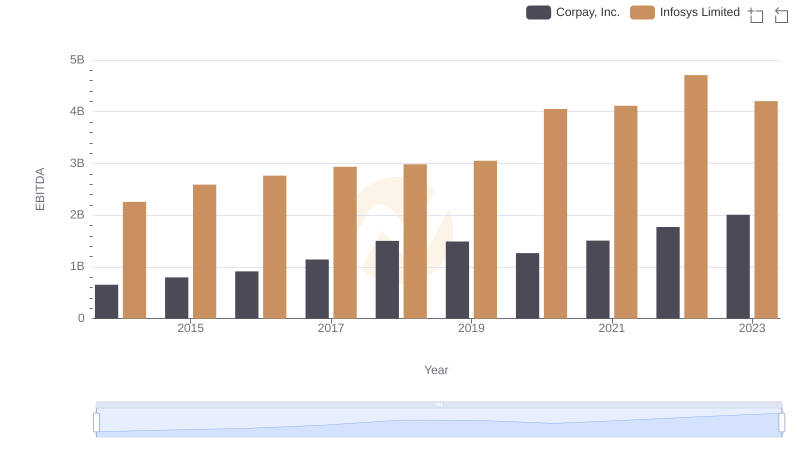
Infosys Limited and Corpay, Inc.: A Detailed Examination of EBITDA Performance
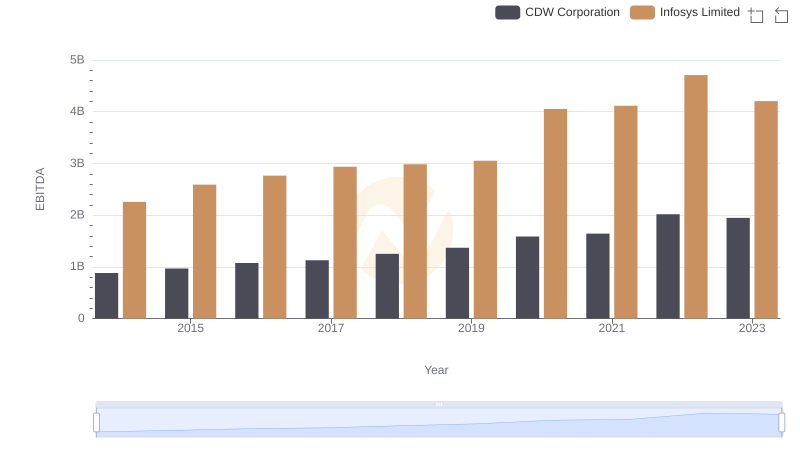
EBITDA Performance Review: Infosys Limited vs CDW Corporation
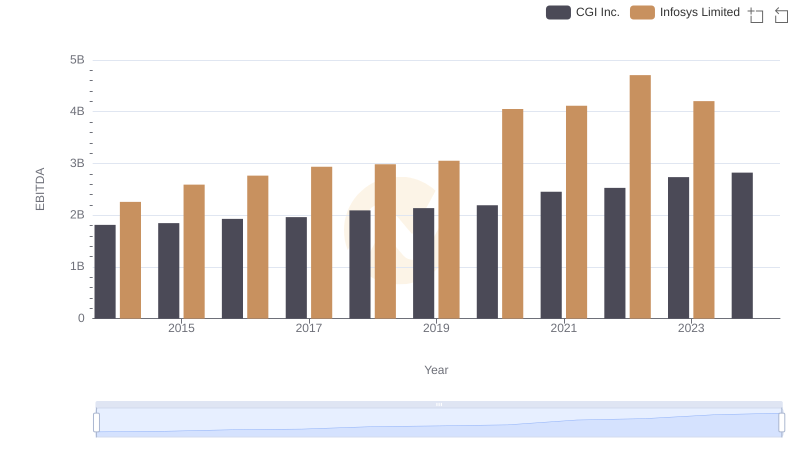
A Professional Review of EBITDA: Infosys Limited Compared to CGI Inc.
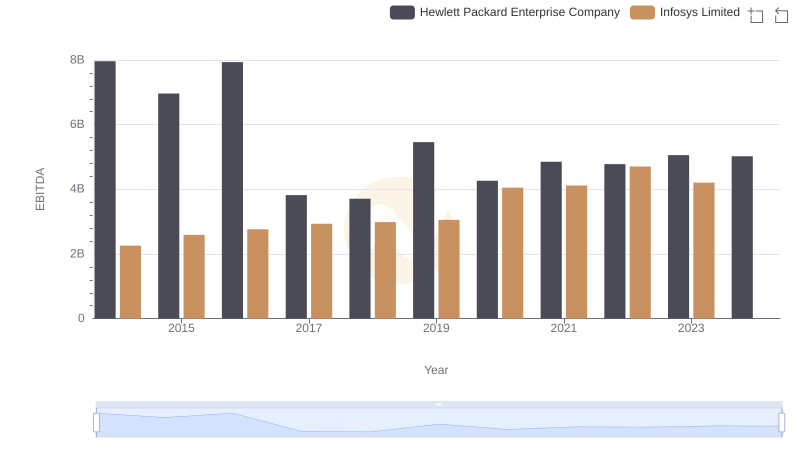
EBITDA Performance Review: Infosys Limited vs Hewlett Packard Enterprise Company
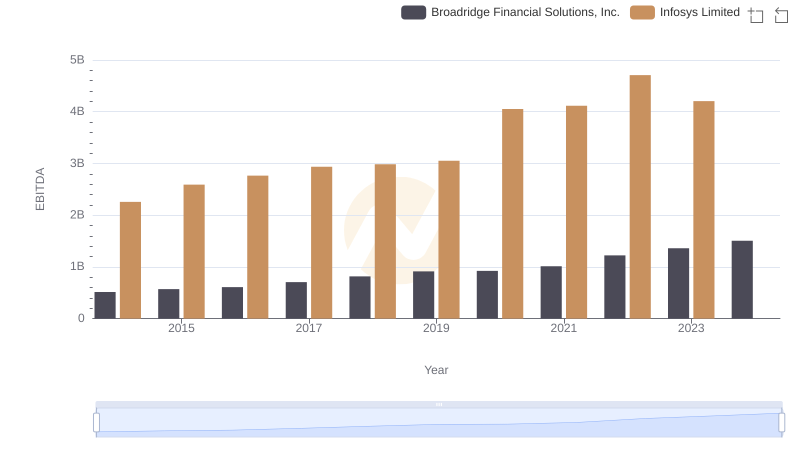
Infosys Limited and Broadridge Financial Solutions, Inc.: A Detailed Examination of EBITDA Performance
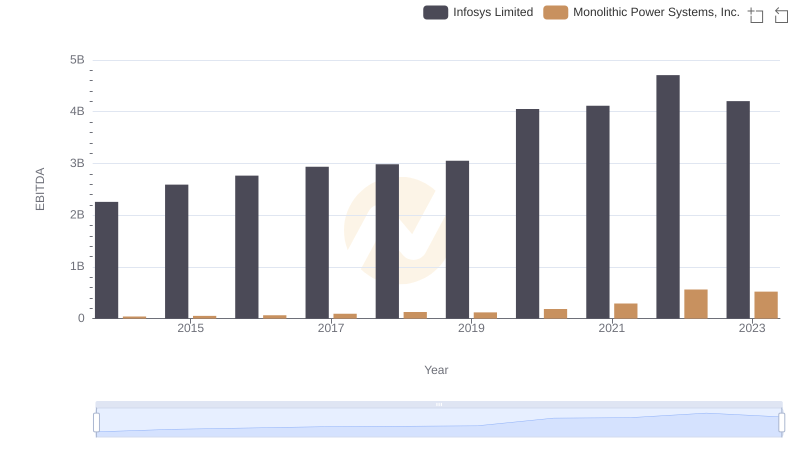
Comparative EBITDA Analysis: Infosys Limited vs Monolithic Power Systems, Inc.
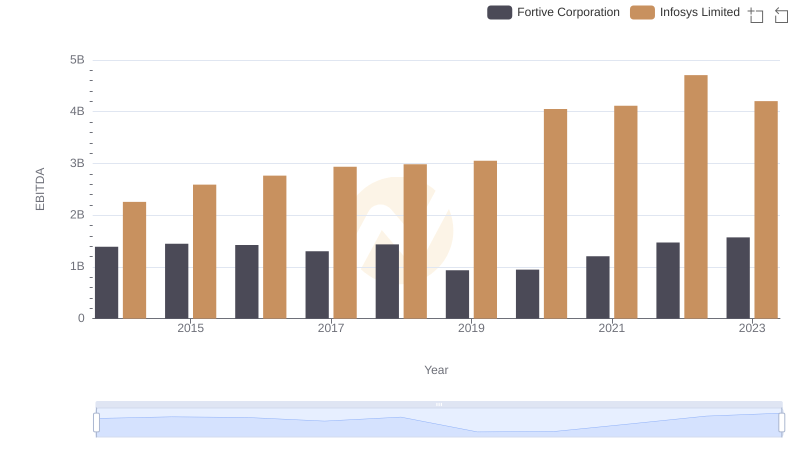
Comprehensive EBITDA Comparison: Infosys Limited vs Fortive Corporation