| __timestamp | ANSYS, Inc. | Infosys Limited |
|---|---|---|
| Wednesday, January 1, 2014 | 153386000 | 5374000000 |
| Thursday, January 1, 2015 | 147246000 | 5950000000 |
| Friday, January 1, 2016 | 146860000 | 6446000000 |
| Sunday, January 1, 2017 | 150164000 | 7001000000 |
| Monday, January 1, 2018 | 155885000 | 7687000000 |
| Tuesday, January 1, 2019 | 166273000 | 8552000000 |
| Wednesday, January 1, 2020 | 225264000 | 8828000000 |
| Friday, January 1, 2021 | 257984000 | 10996000000 |
| Saturday, January 1, 2022 | 250641000 | 12709000000 |
| Sunday, January 1, 2023 | 271298000 | 13096000000 |
| Monday, January 1, 2024 | 279819000 |
Unlocking the unknown
In the ever-evolving landscape of technology, understanding cost dynamics is crucial. This chart delves into the cost of revenue trends for two industry titans: Infosys Limited and ANSYS, Inc., from 2014 to 2023.
Infosys, a global leader in consulting and IT services, has seen its cost of revenue grow by approximately 144% over the past decade. Starting at around $5.4 billion in 2014, it reached a peak of $13.1 billion in 2023. This growth reflects Infosys's expanding operations and increased service delivery capabilities.
ANSYS, renowned for its engineering simulation software, has maintained a more modest growth trajectory. Its cost of revenue increased by about 77% from 2014 to 2023, starting at $153 million and rising to $271 million. This steady increase underscores ANSYS's commitment to innovation and quality.
These trends highlight the contrasting growth strategies of these two companies, offering valuable insights into their operational efficiencies and market positioning.
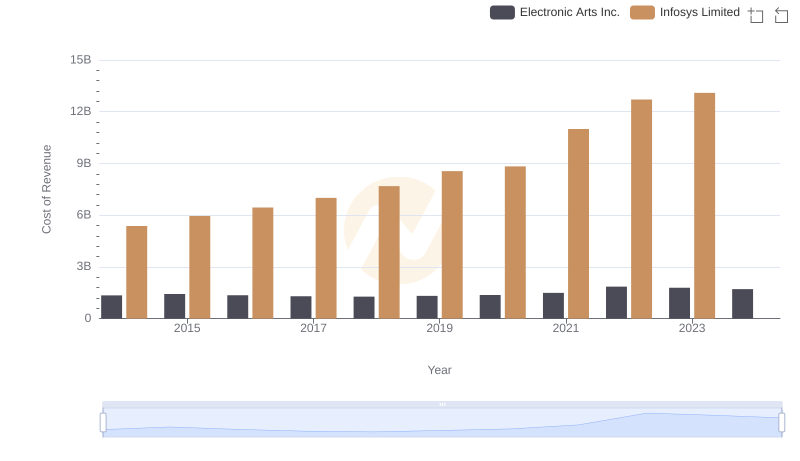
Analyzing Cost of Revenue: Infosys Limited and Electronic Arts Inc.
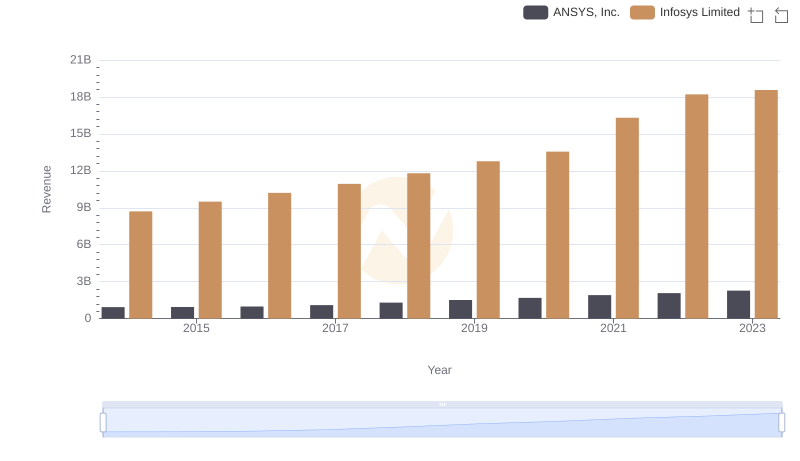
Infosys Limited or ANSYS, Inc.: Who Leads in Yearly Revenue?
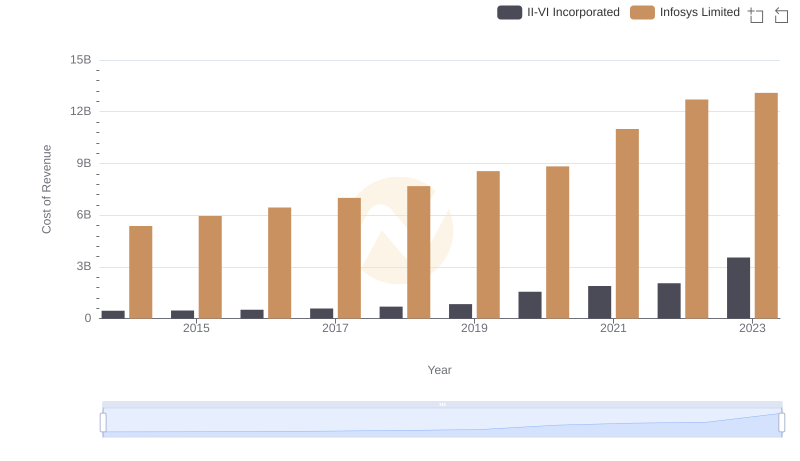
Analyzing Cost of Revenue: Infosys Limited and II-VI Incorporated
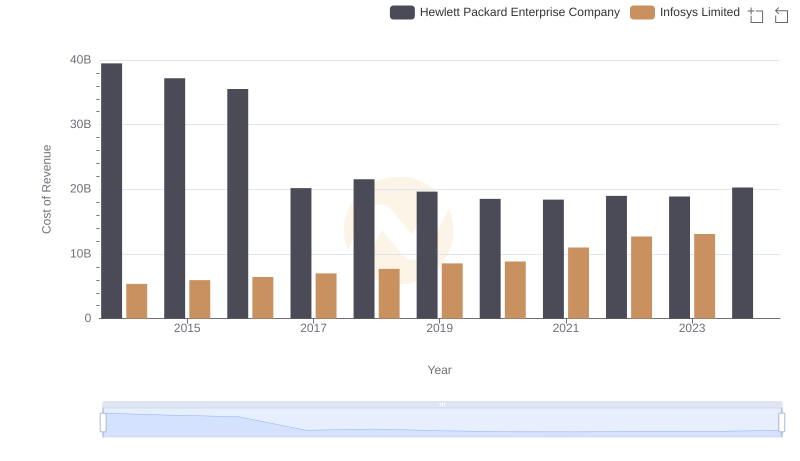
Cost of Revenue Comparison: Infosys Limited vs Hewlett Packard Enterprise Company
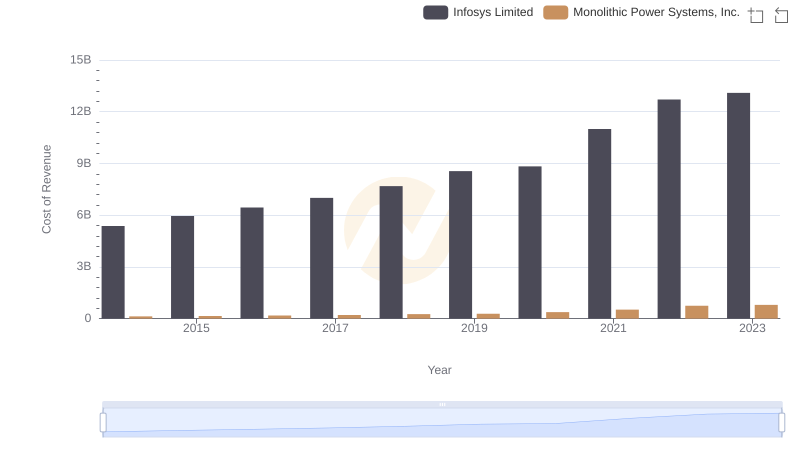
Analyzing Cost of Revenue: Infosys Limited and Monolithic Power Systems, Inc.
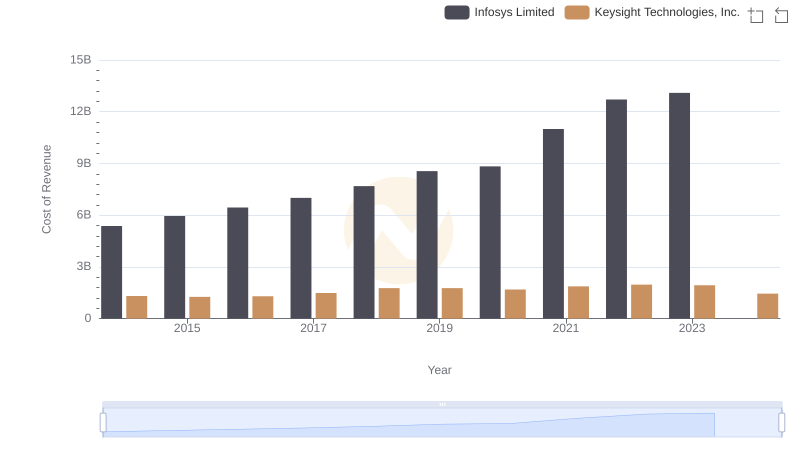
Cost Insights: Breaking Down Infosys Limited and Keysight Technologies, Inc.'s Expenses
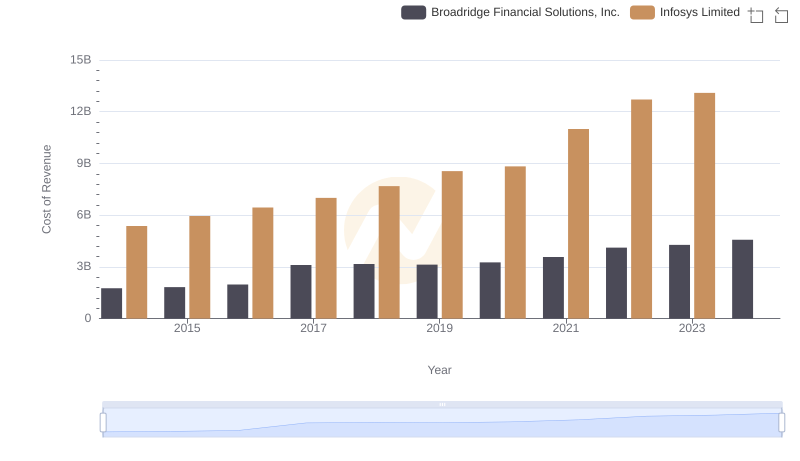
Comparing Cost of Revenue Efficiency: Infosys Limited vs Broadridge Financial Solutions, Inc.
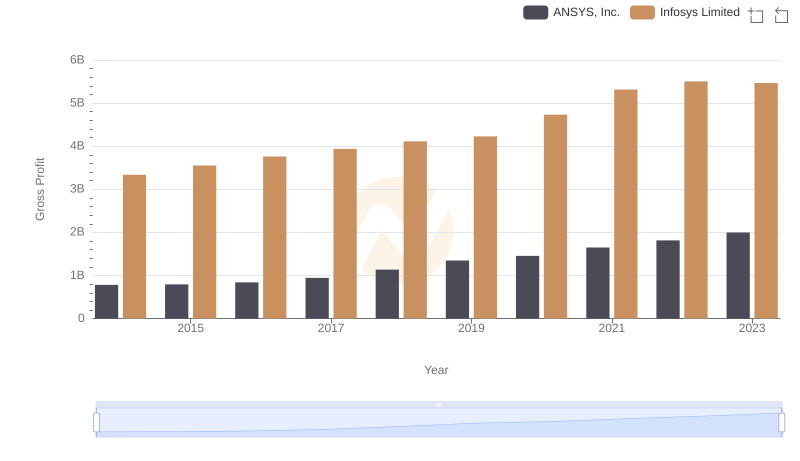
Key Insights on Gross Profit: Infosys Limited vs ANSYS, Inc.
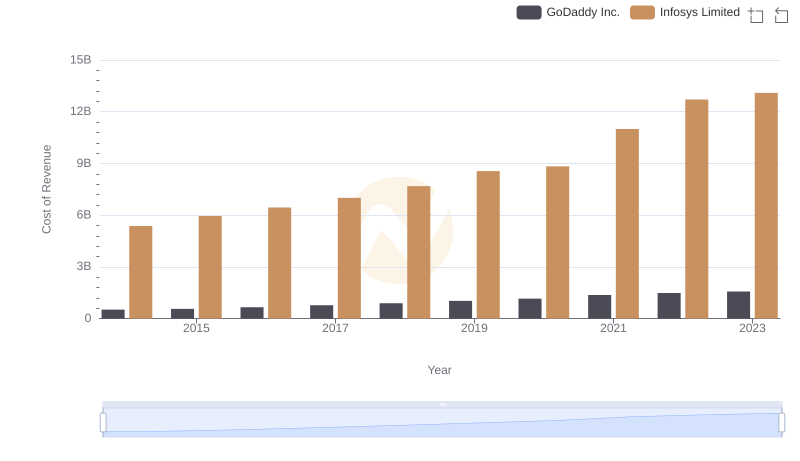
Cost of Revenue: Key Insights for Infosys Limited and GoDaddy Inc.
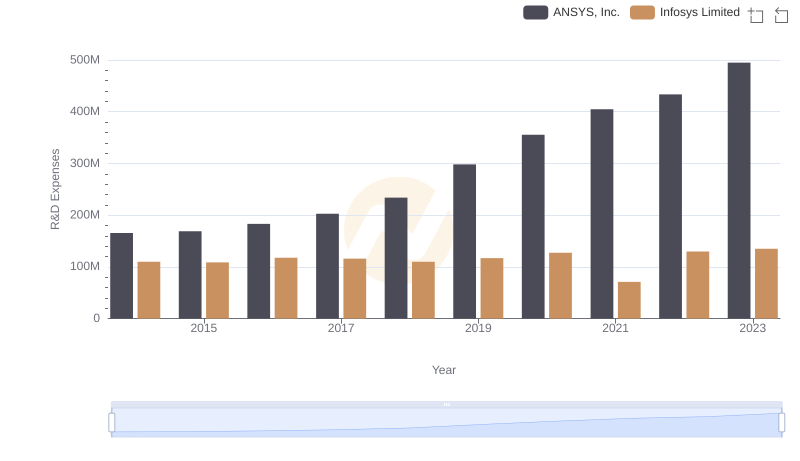
Who Prioritizes Innovation? R&D Spending Compared for Infosys Limited and ANSYS, Inc.
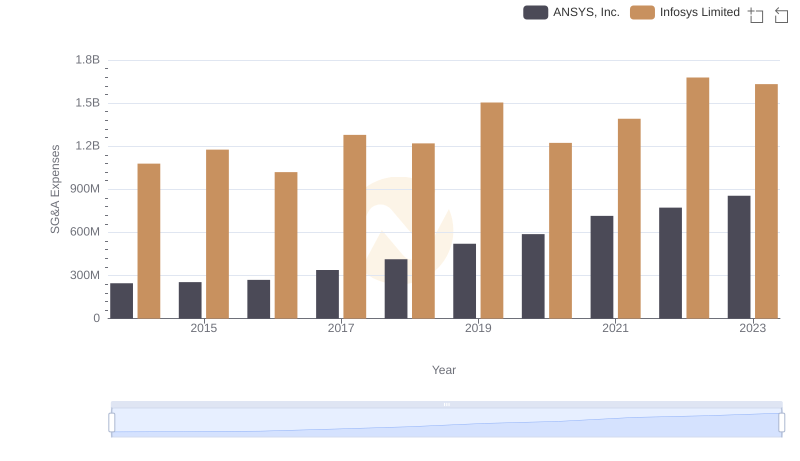
Comparing SG&A Expenses: Infosys Limited vs ANSYS, Inc. Trends and Insights
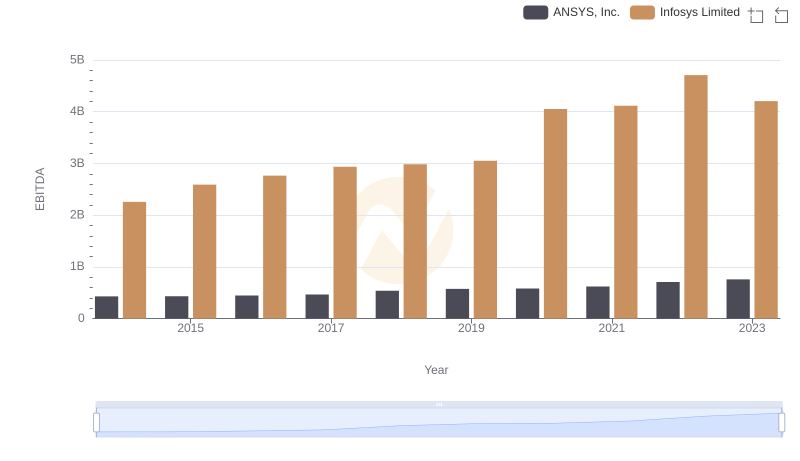
EBITDA Performance Review: Infosys Limited vs ANSYS, Inc.