| __timestamp | Cisco Systems, Inc. | Hewlett Packard Enterprise Company |
|---|---|---|
| Wednesday, January 1, 2014 | 11437000000 | 8717000000 |
| Thursday, January 1, 2015 | 11861000000 | 8025000000 |
| Friday, January 1, 2016 | 11433000000 | 7821000000 |
| Sunday, January 1, 2017 | 11177000000 | 5006000000 |
| Monday, January 1, 2018 | 11386000000 | 4851000000 |
| Tuesday, January 1, 2019 | 11398000000 | 4907000000 |
| Wednesday, January 1, 2020 | 11094000000 | 4624000000 |
| Friday, January 1, 2021 | 11411000000 | 4929000000 |
| Saturday, January 1, 2022 | 11186000000 | 4941000000 |
| Sunday, January 1, 2023 | 12358000000 | 5160000000 |
| Monday, January 1, 2024 | 13177000000 | 4871000000 |
Unleashing the power of data
In the ever-evolving tech industry, understanding financial trends is crucial. Over the past decade, Cisco Systems, Inc. and Hewlett Packard Enterprise Company have shown distinct patterns in their Selling, General, and Administrative (SG&A) expenses. Cisco's SG&A expenses have consistently hovered around $11 billion annually, peaking at $13.2 billion in 2024, marking a 15% increase from 2014. In contrast, Hewlett Packard Enterprise's SG&A expenses have seen a significant decline, dropping from $8.7 billion in 2014 to $4.9 billion in 2024, a reduction of nearly 44%. This divergence highlights Cisco's steady investment in operational activities, while Hewlett Packard Enterprise has streamlined its operations. These trends offer insights into each company's strategic priorities and operational efficiencies, providing a window into their competitive positioning in the tech landscape.
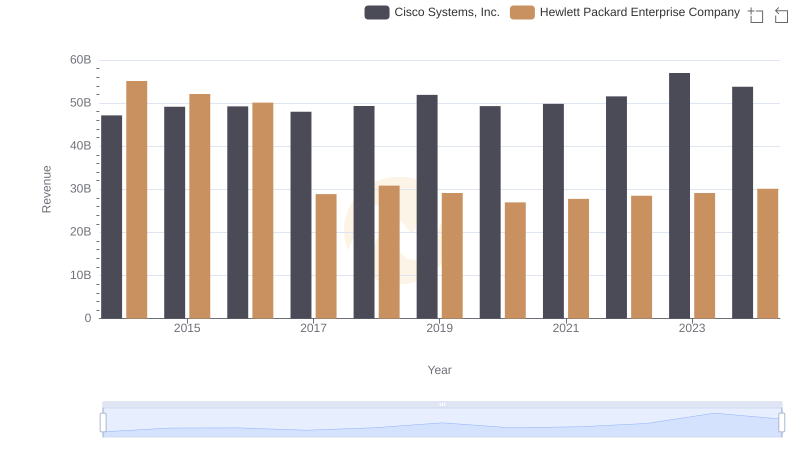
Who Generates More Revenue? Cisco Systems, Inc. or Hewlett Packard Enterprise Company
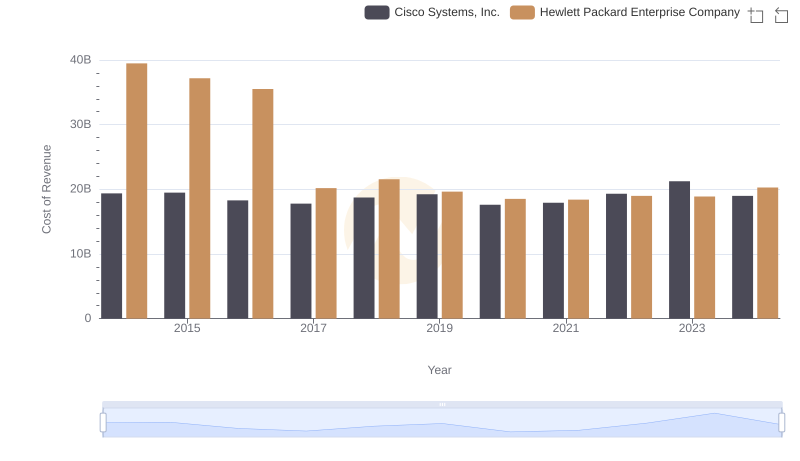
Cost of Revenue Comparison: Cisco Systems, Inc. vs Hewlett Packard Enterprise Company
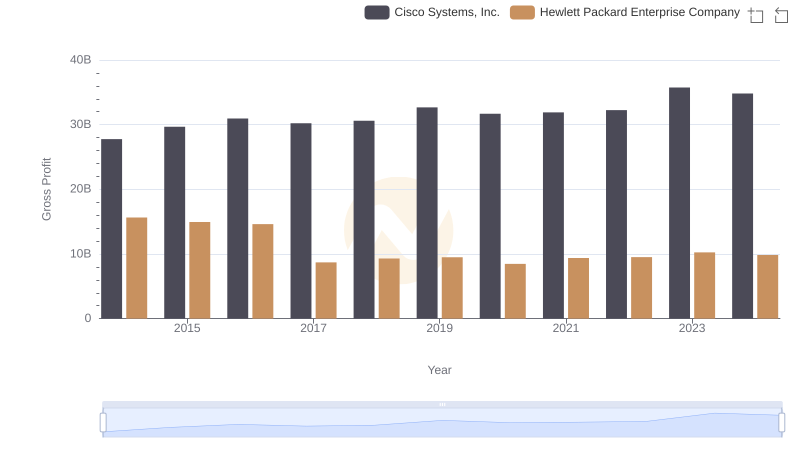
Key Insights on Gross Profit: Cisco Systems, Inc. vs Hewlett Packard Enterprise Company
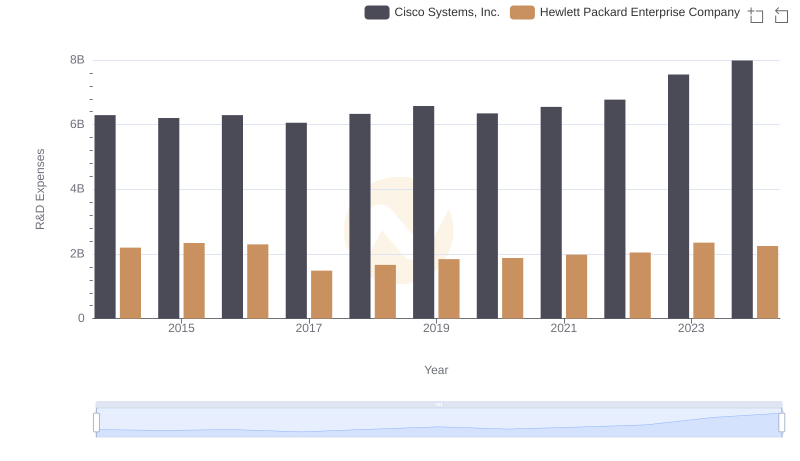
R&D Spending Showdown: Cisco Systems, Inc. vs Hewlett Packard Enterprise Company
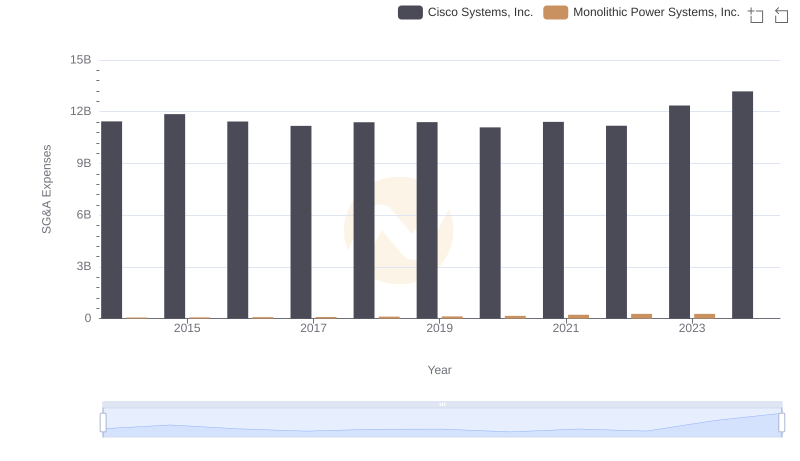
Breaking Down SG&A Expenses: Cisco Systems, Inc. vs Monolithic Power Systems, Inc.
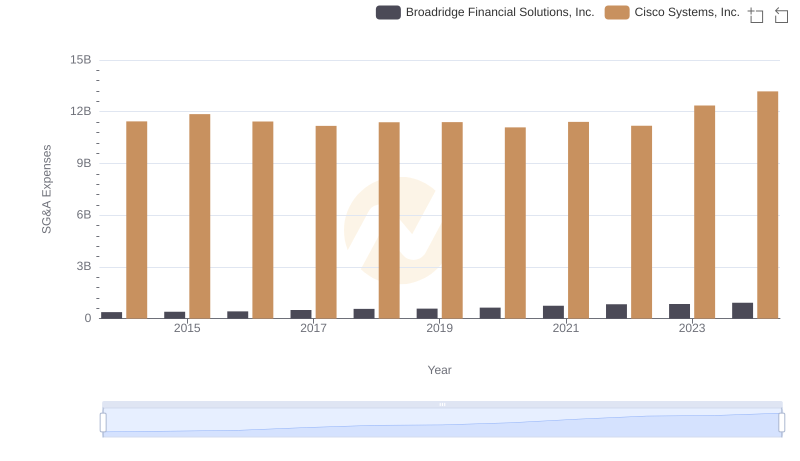
Breaking Down SG&A Expenses: Cisco Systems, Inc. vs Broadridge Financial Solutions, Inc.
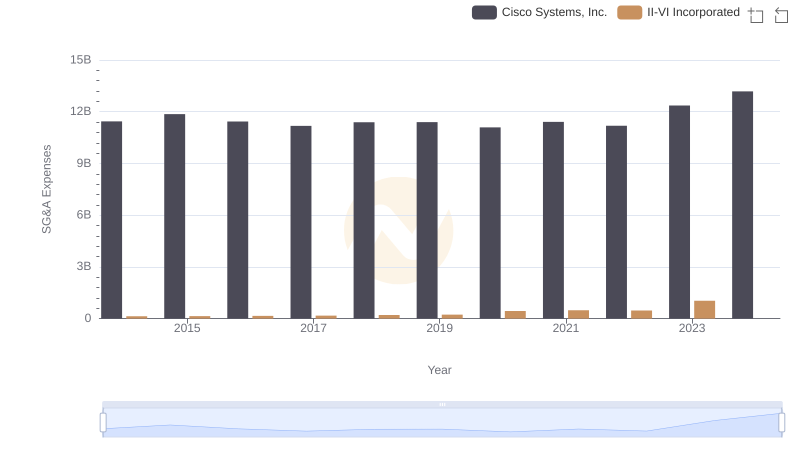
Operational Costs Compared: SG&A Analysis of Cisco Systems, Inc. and II-VI Incorporated
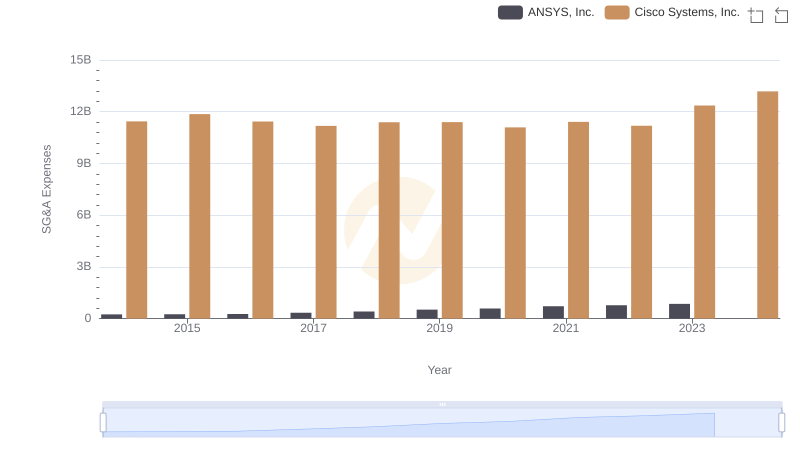
Cisco Systems, Inc. vs ANSYS, Inc.: SG&A Expense Trends
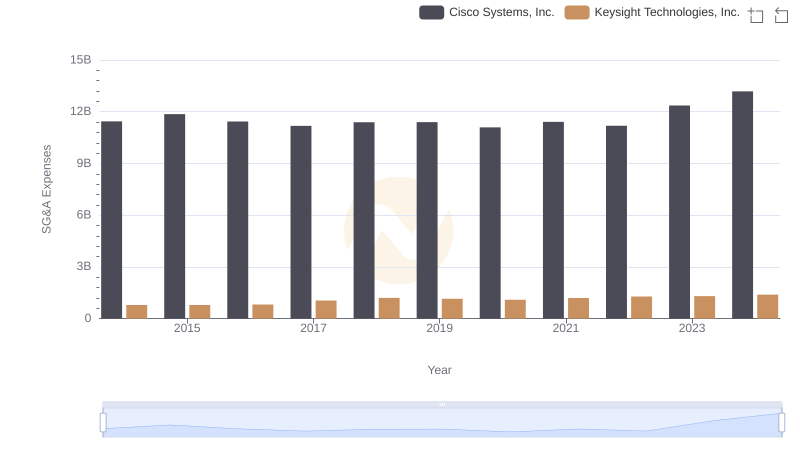
Cost Management Insights: SG&A Expenses for Cisco Systems, Inc. and Keysight Technologies, Inc.
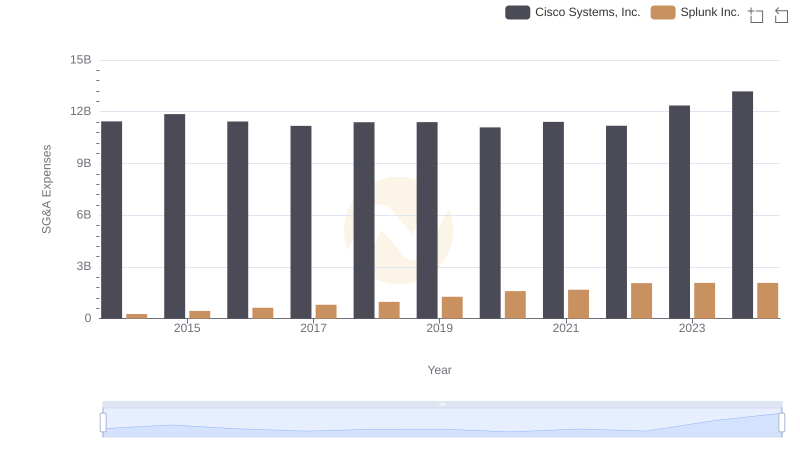
Comparing SG&A Expenses: Cisco Systems, Inc. vs Splunk Inc. Trends and Insights
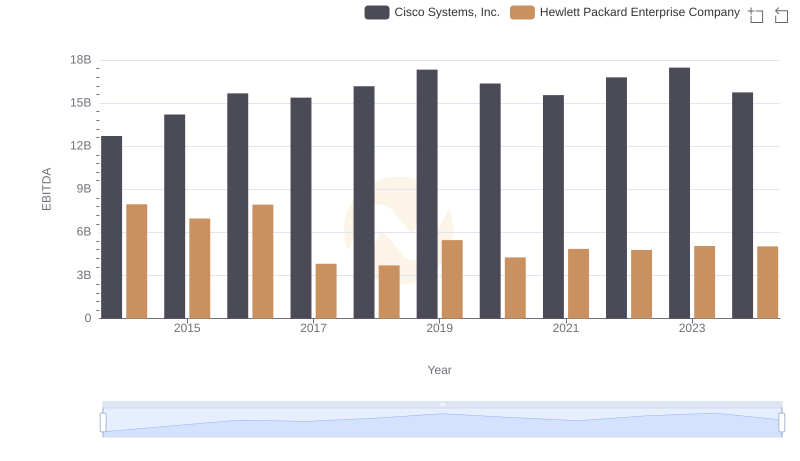
Comparative EBITDA Analysis: Cisco Systems, Inc. vs Hewlett Packard Enterprise Company
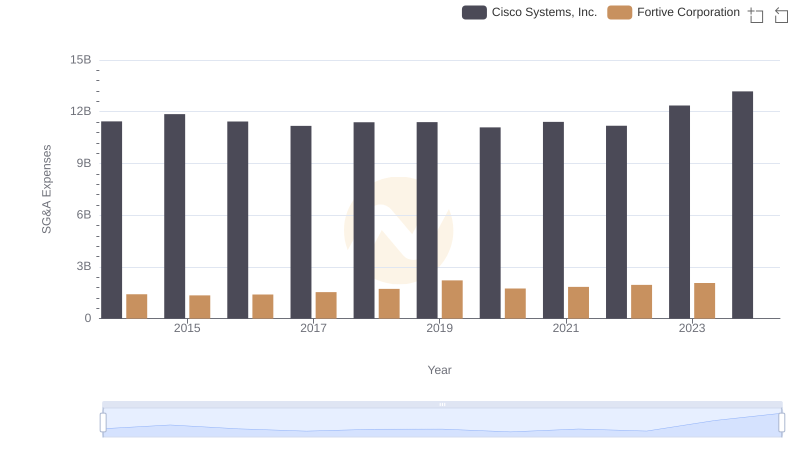
Operational Costs Compared: SG&A Analysis of Cisco Systems, Inc. and Fortive Corporation