| __timestamp | Cisco Systems, Inc. | Fortive Corporation |
|---|---|---|
| Wednesday, January 1, 2014 | 11437000000 | 1416300000 |
| Thursday, January 1, 2015 | 11861000000 | 1347900000 |
| Friday, January 1, 2016 | 11433000000 | 1402000000 |
| Sunday, January 1, 2017 | 11177000000 | 1537600000 |
| Monday, January 1, 2018 | 11386000000 | 1728600000 |
| Tuesday, January 1, 2019 | 11398000000 | 2219500000 |
| Wednesday, January 1, 2020 | 11094000000 | 1748400000 |
| Friday, January 1, 2021 | 11411000000 | 1839500000 |
| Saturday, January 1, 2022 | 11186000000 | 1956600000 |
| Sunday, January 1, 2023 | 12358000000 | 2062600000 |
| Monday, January 1, 2024 | 13177000000 | 2173500000 |
Cracking the code
In the ever-evolving tech landscape, operational efficiency is paramount. This analysis delves into the Selling, General, and Administrative (SG&A) expenses of two industry giants: Cisco Systems, Inc. and Fortive Corporation, from 2014 to 2023. Cisco, a leader in networking technology, consistently reported higher SG&A expenses, peaking at approximately $13.2 billion in 2024, reflecting a 15% increase from 2014. In contrast, Fortive, a diversified industrial technology company, saw its SG&A expenses rise by 46% over the same period, reaching around $2.2 billion in 2019. This disparity highlights Cisco's expansive operational scale compared to Fortive's more focused approach. Notably, data for Fortive in 2024 is missing, suggesting potential shifts in reporting or strategy. As these companies navigate the complexities of the digital age, understanding their cost structures offers valuable insights into their strategic priorities and market positioning.
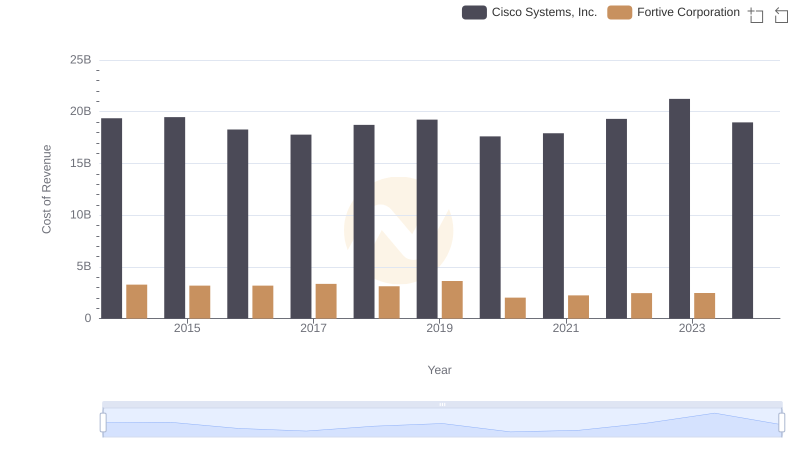
Comparing Cost of Revenue Efficiency: Cisco Systems, Inc. vs Fortive Corporation
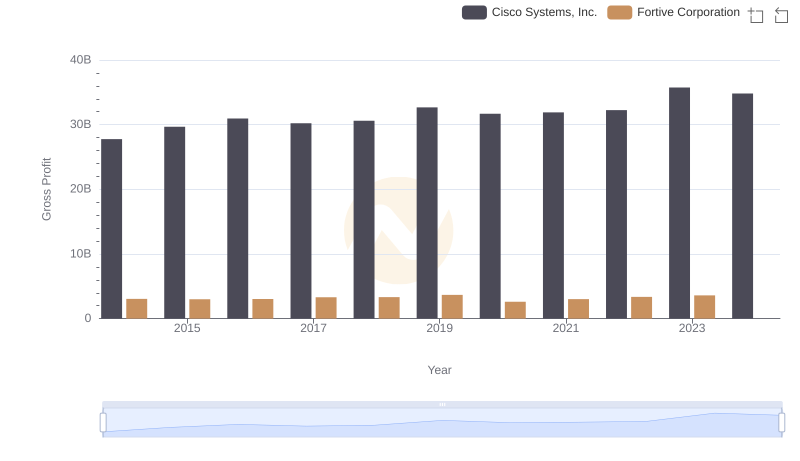
Key Insights on Gross Profit: Cisco Systems, Inc. vs Fortive Corporation
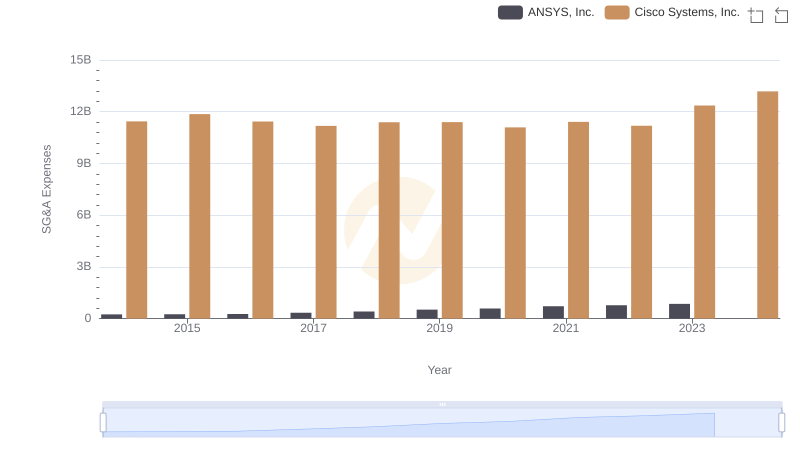
Cisco Systems, Inc. vs ANSYS, Inc.: SG&A Expense Trends
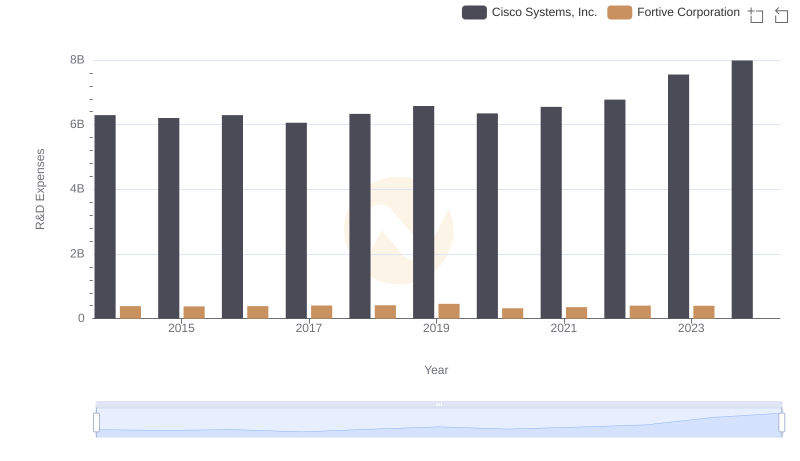
Who Prioritizes Innovation? R&D Spending Compared for Cisco Systems, Inc. and Fortive Corporation
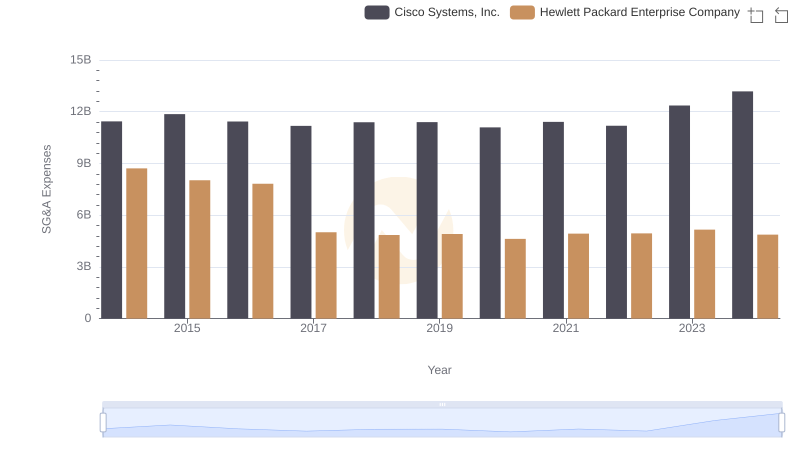
Comparing SG&A Expenses: Cisco Systems, Inc. vs Hewlett Packard Enterprise Company Trends and Insights
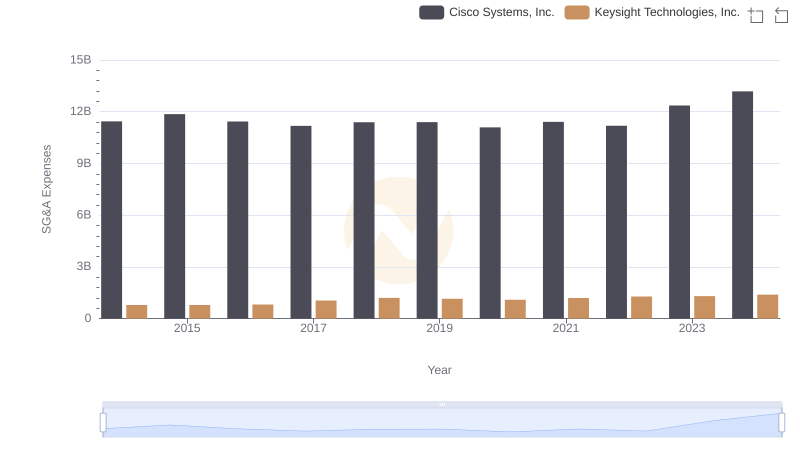
Cost Management Insights: SG&A Expenses for Cisco Systems, Inc. and Keysight Technologies, Inc.
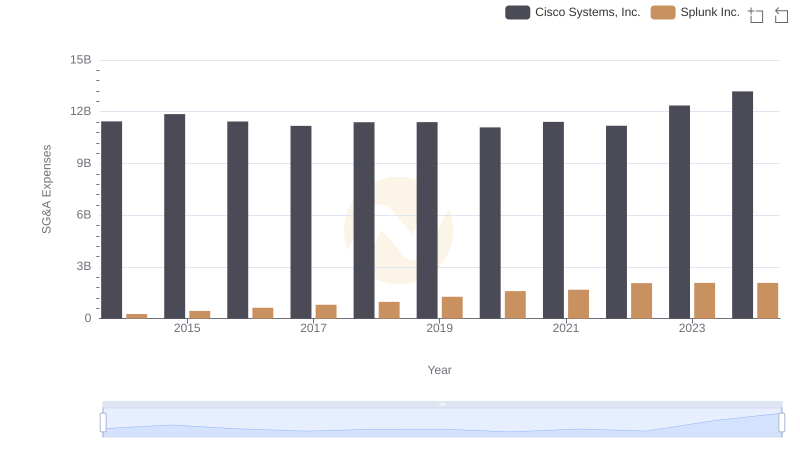
Comparing SG&A Expenses: Cisco Systems, Inc. vs Splunk Inc. Trends and Insights
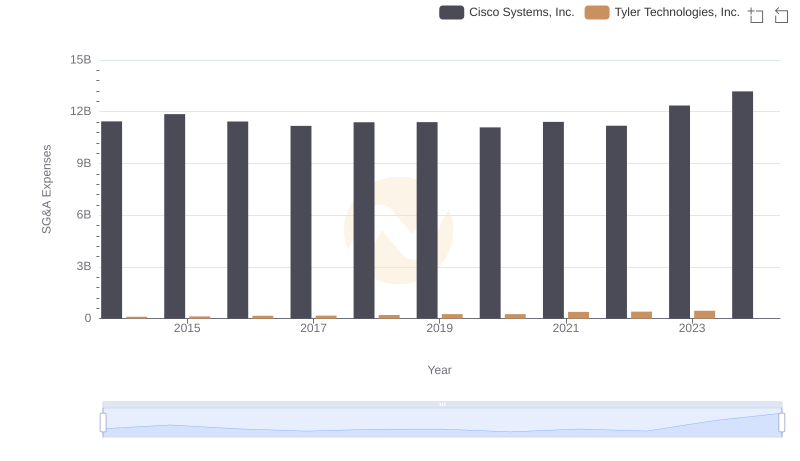
Breaking Down SG&A Expenses: Cisco Systems, Inc. vs Tyler Technologies, Inc.
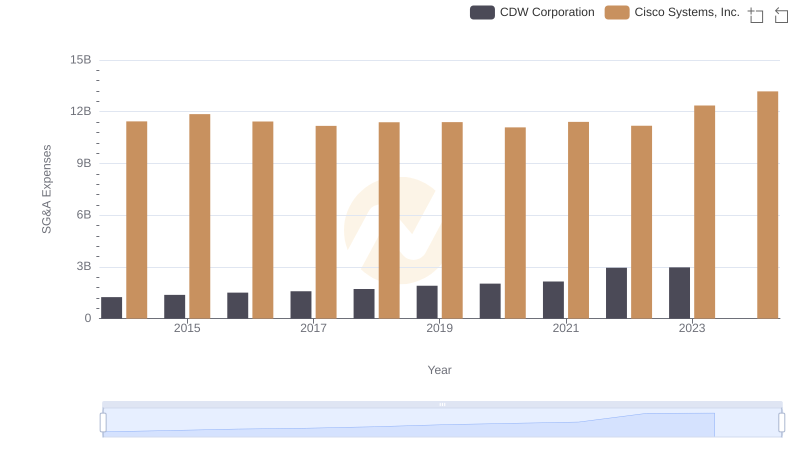
Cisco Systems, Inc. or CDW Corporation: Who Manages SG&A Costs Better?
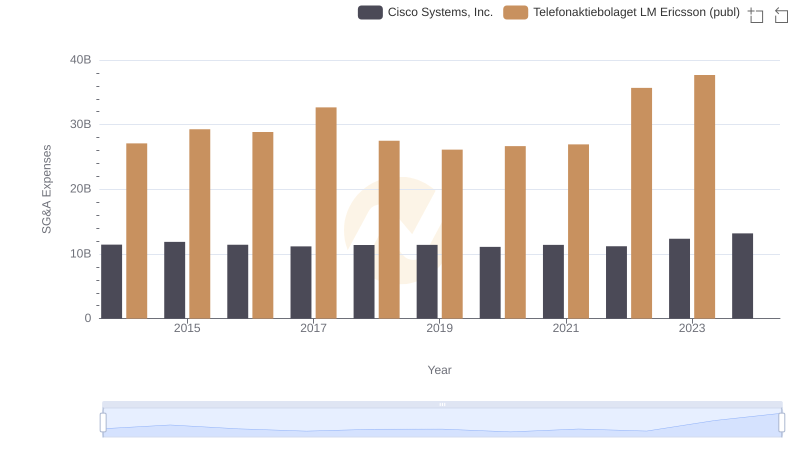
Operational Costs Compared: SG&A Analysis of Cisco Systems, Inc. and Telefonaktiebolaget LM Ericsson (publ)
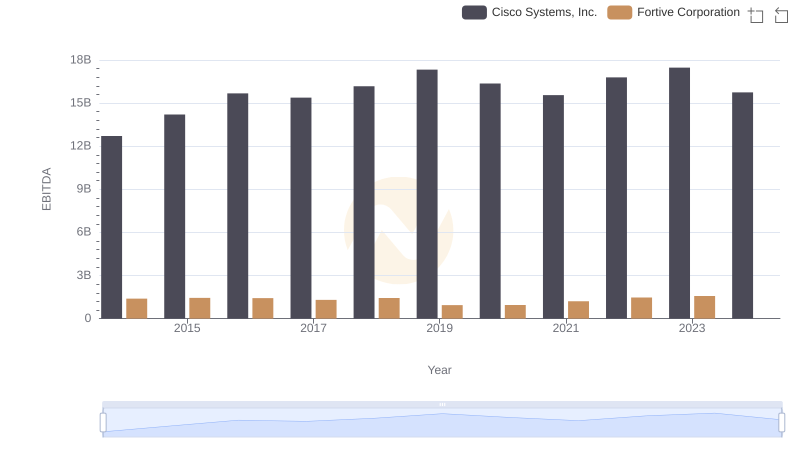
Comprehensive EBITDA Comparison: Cisco Systems, Inc. vs Fortive Corporation