| __timestamp | Cisco Systems, Inc. | II-VI Incorporated |
|---|---|---|
| Wednesday, January 1, 2014 | 11437000000 | 137707000 |
| Thursday, January 1, 2015 | 11861000000 | 143539000 |
| Friday, January 1, 2016 | 11433000000 | 160646000 |
| Sunday, January 1, 2017 | 11177000000 | 176002000 |
| Monday, January 1, 2018 | 11386000000 | 208565000 |
| Tuesday, January 1, 2019 | 11398000000 | 233518000 |
| Wednesday, January 1, 2020 | 11094000000 | 440998000 |
| Friday, January 1, 2021 | 11411000000 | 483989000 |
| Saturday, January 1, 2022 | 11186000000 | 474096000 |
| Sunday, January 1, 2023 | 12358000000 | 1036699000 |
| Monday, January 1, 2024 | 13177000000 | 854001000 |
Unveiling the hidden dimensions of data
In the ever-evolving tech industry, operational efficiency is key to maintaining a competitive edge. This analysis delves into the Selling, General, and Administrative (SG&A) expenses of two industry giants: Cisco Systems, Inc. and II-VI Incorporated, from 2014 to 2023.
Cisco, a leader in networking technology, consistently reported SG&A expenses averaging around $11.6 billion annually. Notably, in 2023, Cisco's expenses surged by approximately 10% compared to the previous year, reflecting strategic investments in innovation and market expansion.
Conversely, II-VI Incorporated, a prominent player in engineered materials and optoelectronic components, exhibited a more dynamic trend. Their SG&A expenses grew significantly, peaking in 2023 with a 115% increase from 2022, indicating aggressive growth strategies.
This comparative analysis highlights the contrasting financial strategies of these tech titans, offering insights into their operational priorities and market positioning.
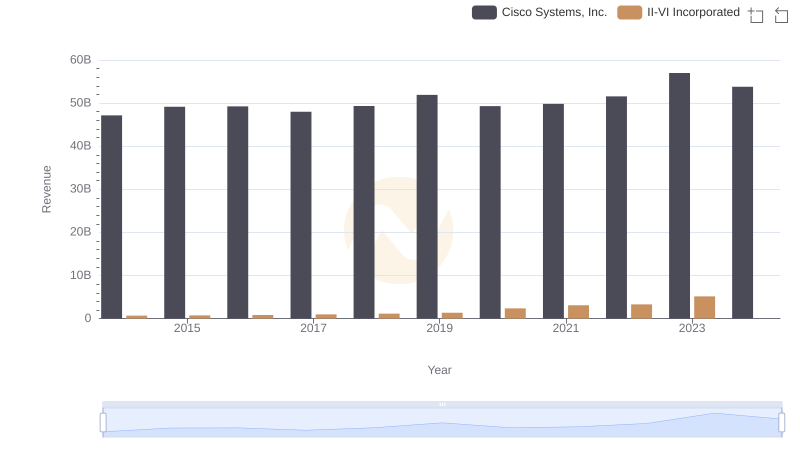
Who Generates More Revenue? Cisco Systems, Inc. or II-VI Incorporated
Cost Insights: Breaking Down Cisco Systems, Inc. and II-VI Incorporated's Expenses
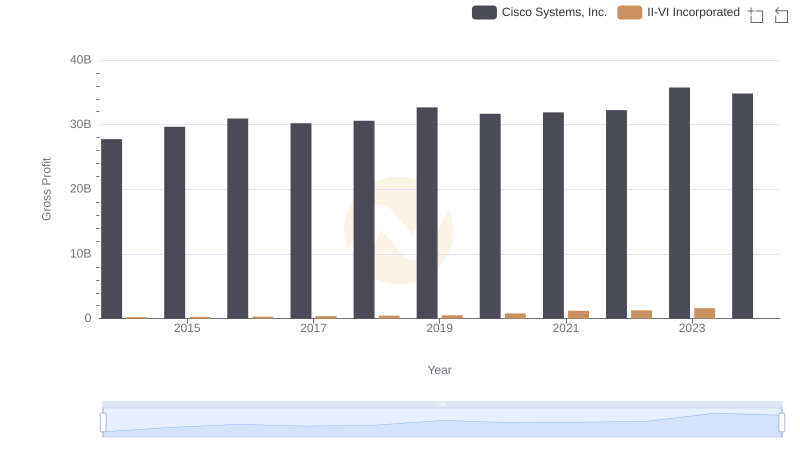
Gross Profit Analysis: Comparing Cisco Systems, Inc. and II-VI Incorporated
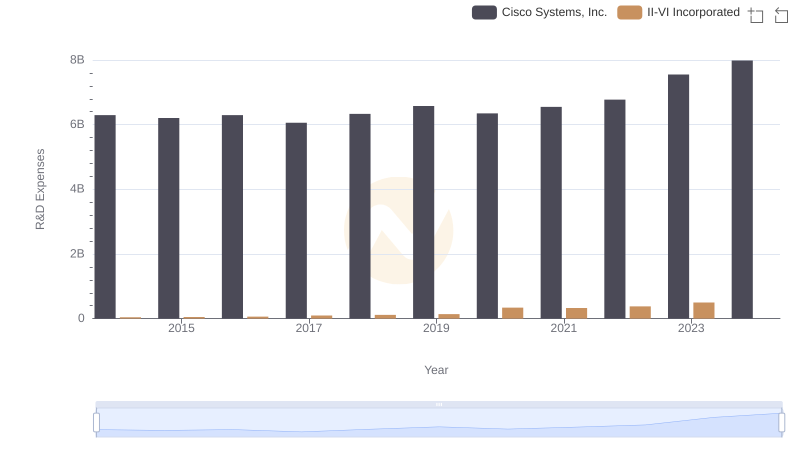
Research and Development Expenses Breakdown: Cisco Systems, Inc. vs II-VI Incorporated
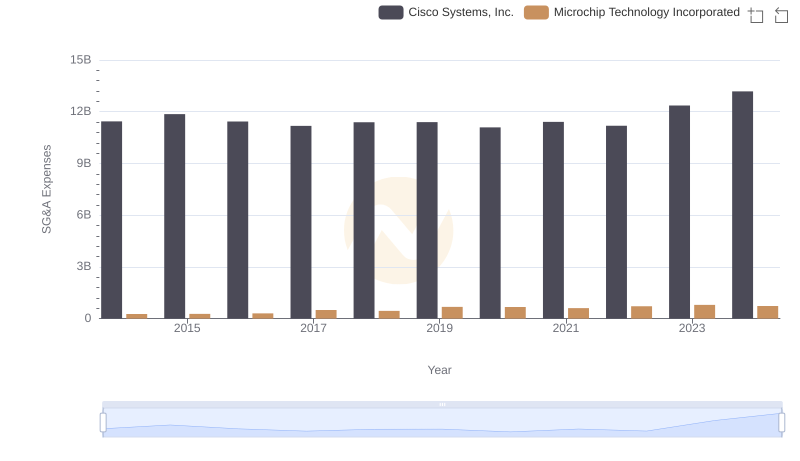
Selling, General, and Administrative Costs: Cisco Systems, Inc. vs Microchip Technology Incorporated
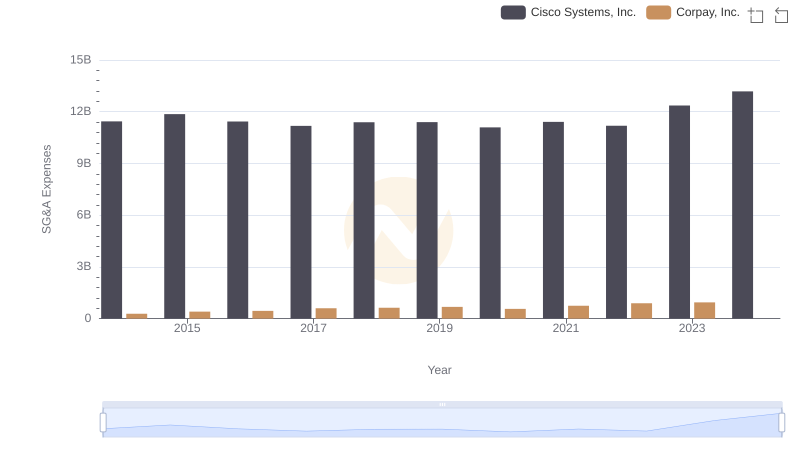
Cisco Systems, Inc. and Corpay, Inc.: SG&A Spending Patterns Compared
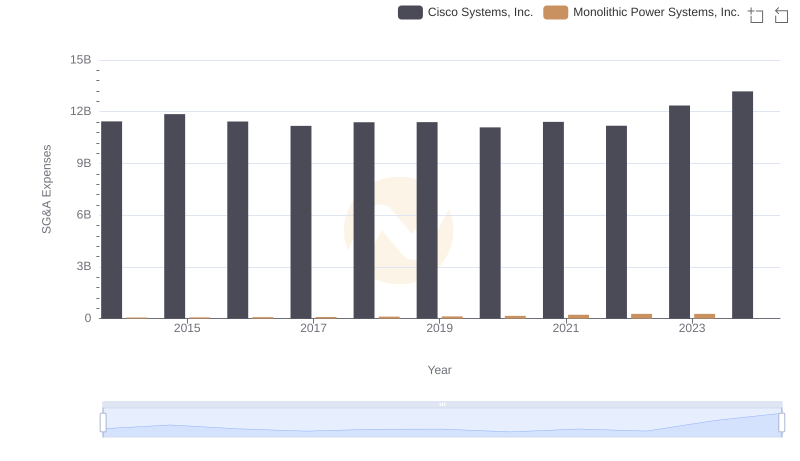
Breaking Down SG&A Expenses: Cisco Systems, Inc. vs Monolithic Power Systems, Inc.
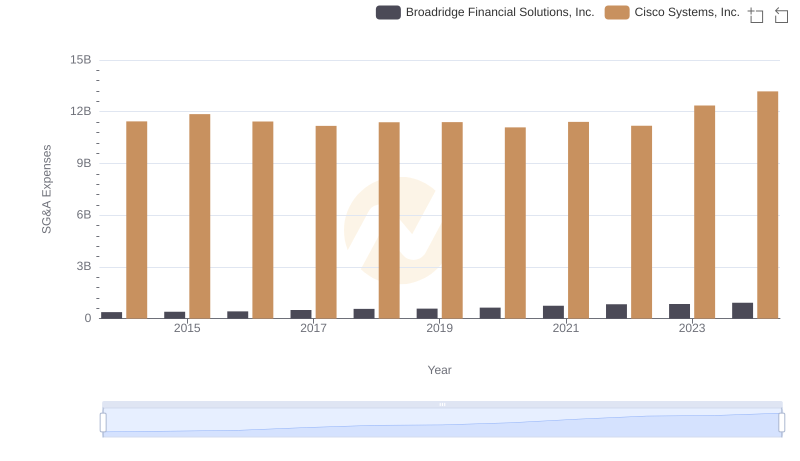
Breaking Down SG&A Expenses: Cisco Systems, Inc. vs Broadridge Financial Solutions, Inc.
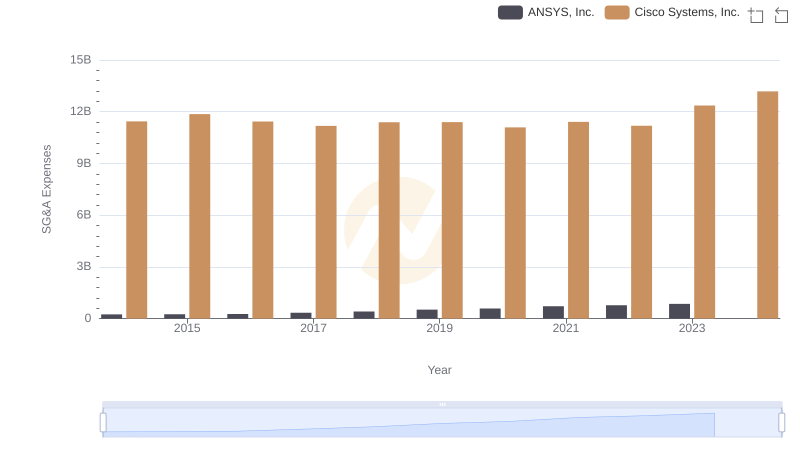
Cisco Systems, Inc. vs ANSYS, Inc.: SG&A Expense Trends
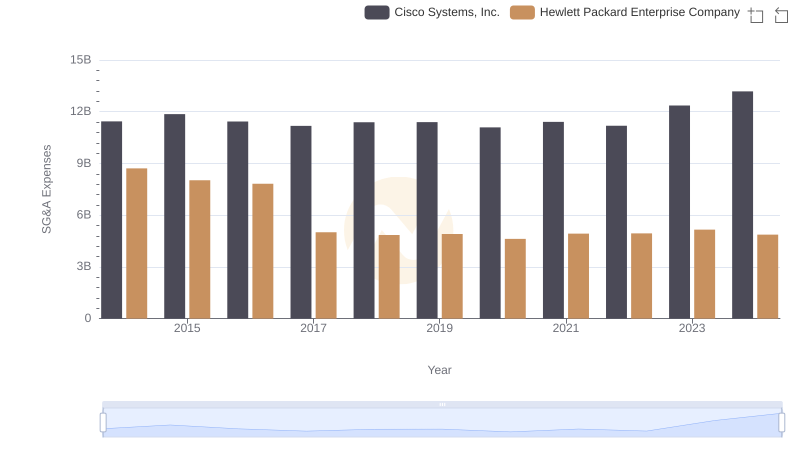
Comparing SG&A Expenses: Cisco Systems, Inc. vs Hewlett Packard Enterprise Company Trends and Insights
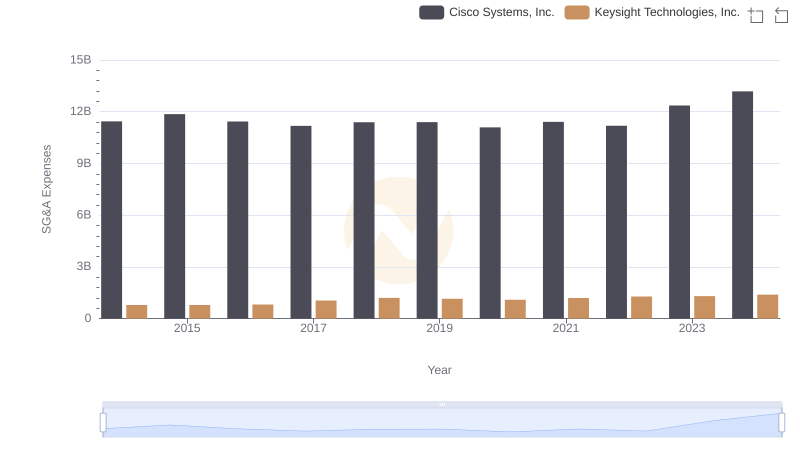
Cost Management Insights: SG&A Expenses for Cisco Systems, Inc. and Keysight Technologies, Inc.
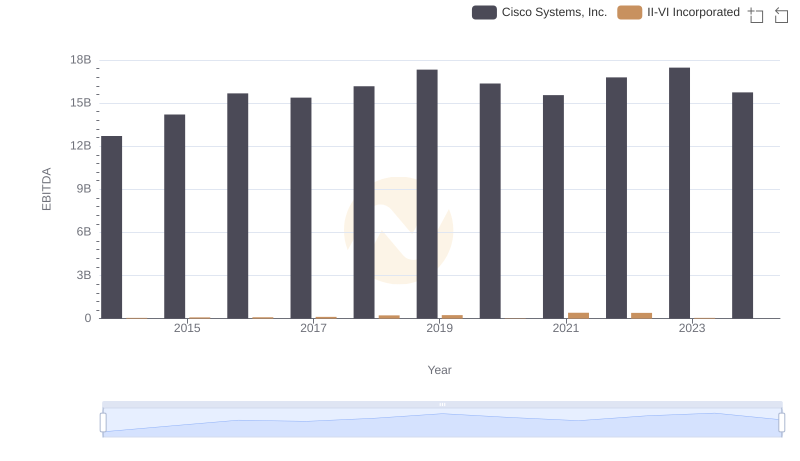
EBITDA Performance Review: Cisco Systems, Inc. vs II-VI Incorporated