| __timestamp | Axon Enterprise, Inc. | Owens Corning |
|---|---|---|
| Wednesday, January 1, 2014 | 101548000 | 976000000 |
| Thursday, January 1, 2015 | 128647000 | 1153000000 |
| Friday, January 1, 2016 | 170536000 | 1381000000 |
| Sunday, January 1, 2017 | 207088000 | 1572000000 |
| Monday, January 1, 2018 | 258583000 | 1632000000 |
| Tuesday, January 1, 2019 | 307286000 | 1609000000 |
| Wednesday, January 1, 2020 | 416331000 | 1610000000 |
| Friday, January 1, 2021 | 540910000 | 2217000000 |
| Saturday, January 1, 2022 | 728638000 | 2616000000 |
| Sunday, January 1, 2023 | 955382000 | 2683000000 |
Unleashing insights
In the ever-evolving landscape of American industry, the financial performance of companies like Axon Enterprise, Inc. and Owens Corning offers a fascinating glimpse into their strategic prowess. Over the past decade, from 2014 to 2023, Axon Enterprise has demonstrated a remarkable growth trajectory, with its gross profit surging by over 840%, from approximately $101 million to $955 million. This growth reflects Axon's innovative approach in the public safety technology sector.
Conversely, Owens Corning, a stalwart in the building materials industry, has maintained a steady upward trend, with its gross profit increasing by about 175% during the same period, reaching nearly $2.7 billion in 2023. This consistent performance underscores Owens Corning's resilience and adaptability in a competitive market. As we delve into these financial narratives, it becomes evident that both companies, despite operating in distinct sectors, have successfully navigated the challenges of the past decade.
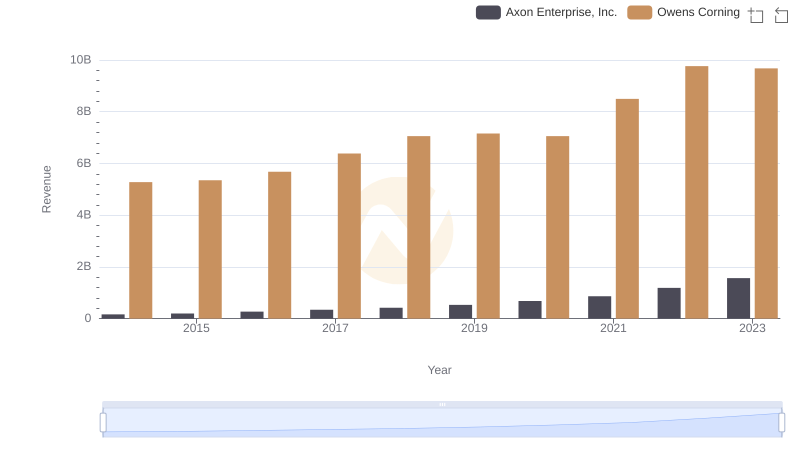
Who Generates More Revenue? Axon Enterprise, Inc. or Owens Corning
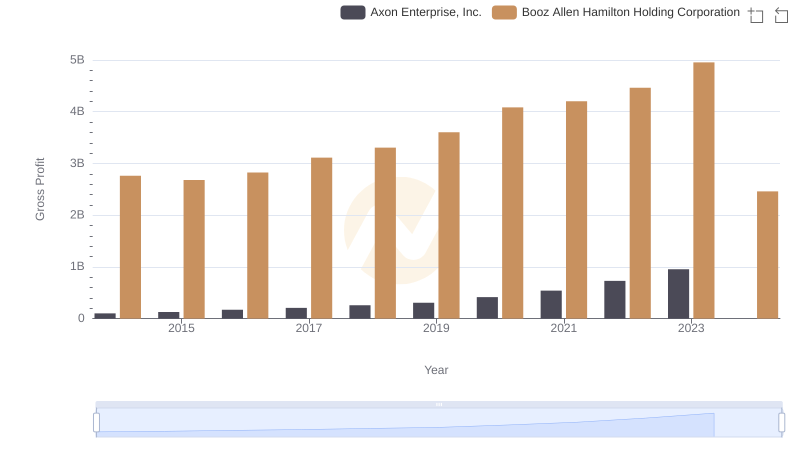
Axon Enterprise, Inc. and Booz Allen Hamilton Holding Corporation: A Detailed Gross Profit Analysis
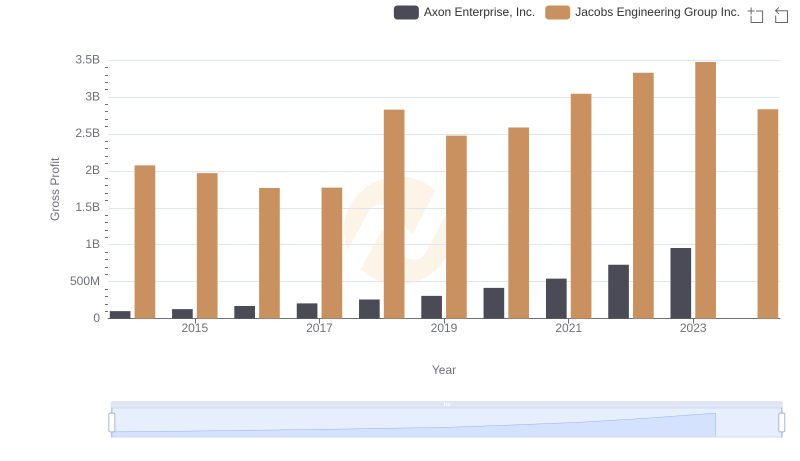
Axon Enterprise, Inc. vs Jacobs Engineering Group Inc.: A Gross Profit Performance Breakdown
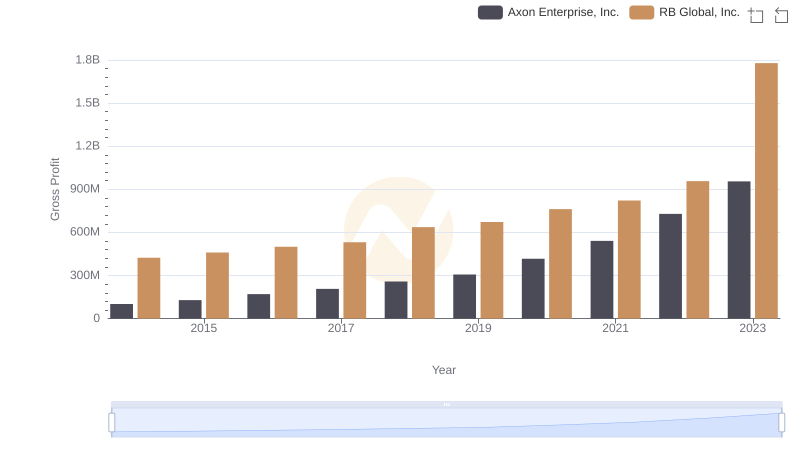
Gross Profit Trends Compared: Axon Enterprise, Inc. vs RB Global, Inc.
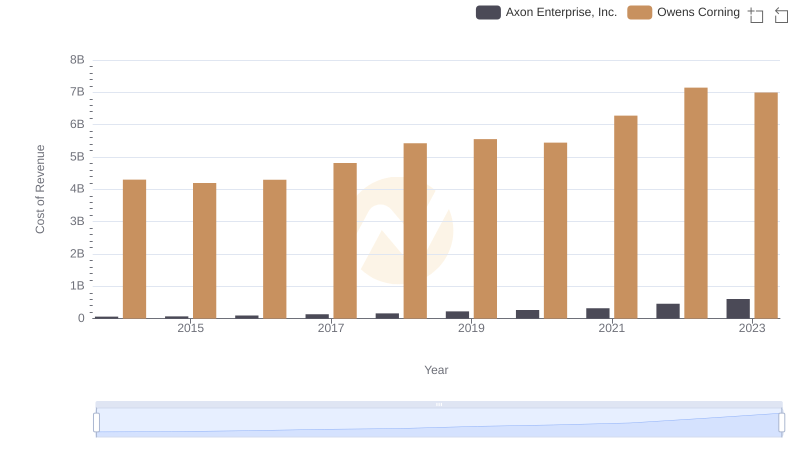
Cost of Revenue: Key Insights for Axon Enterprise, Inc. and Owens Corning
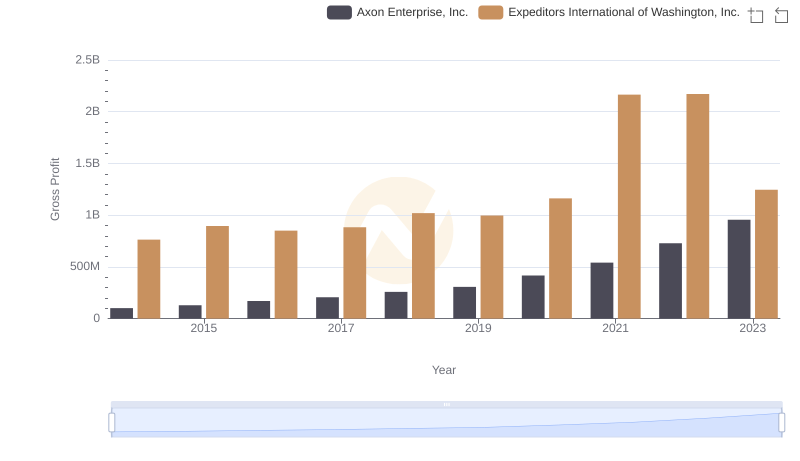
Who Generates Higher Gross Profit? Axon Enterprise, Inc. or Expeditors International of Washington, Inc.
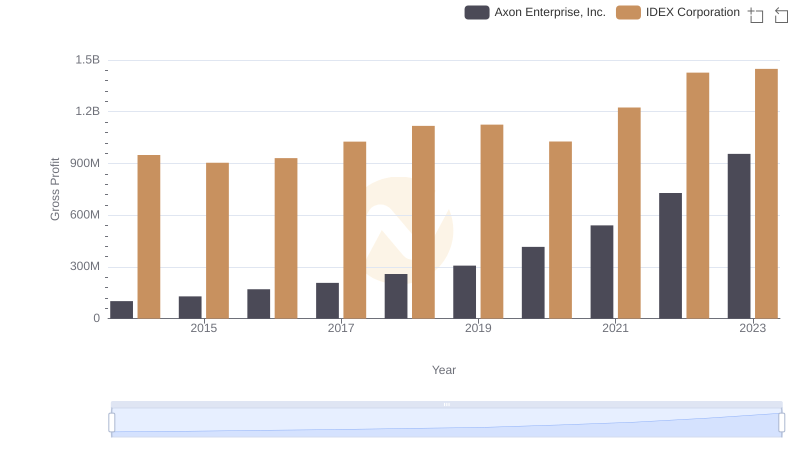
Key Insights on Gross Profit: Axon Enterprise, Inc. vs IDEX Corporation
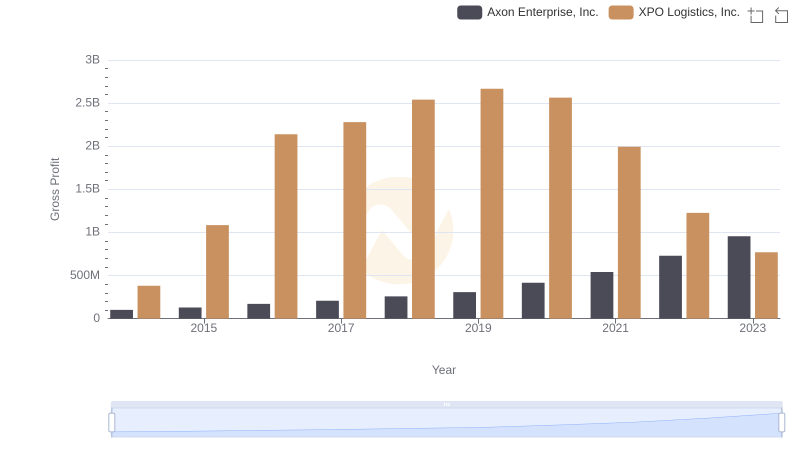
Axon Enterprise, Inc. vs XPO Logistics, Inc.: A Gross Profit Performance Breakdown
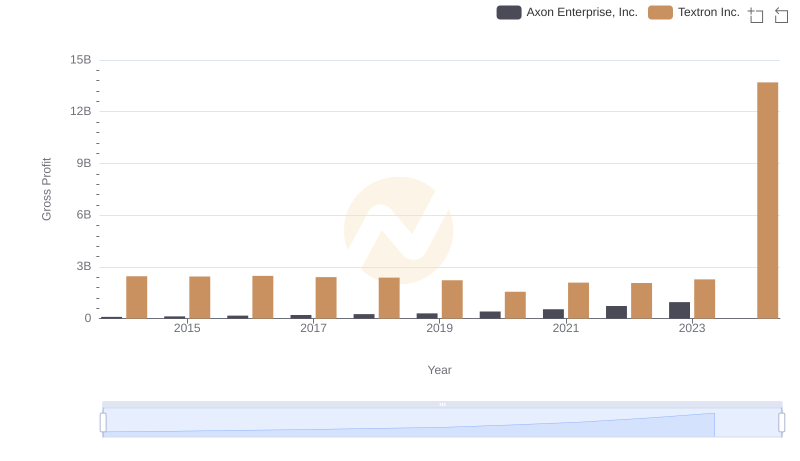
Who Generates Higher Gross Profit? Axon Enterprise, Inc. or Textron Inc.
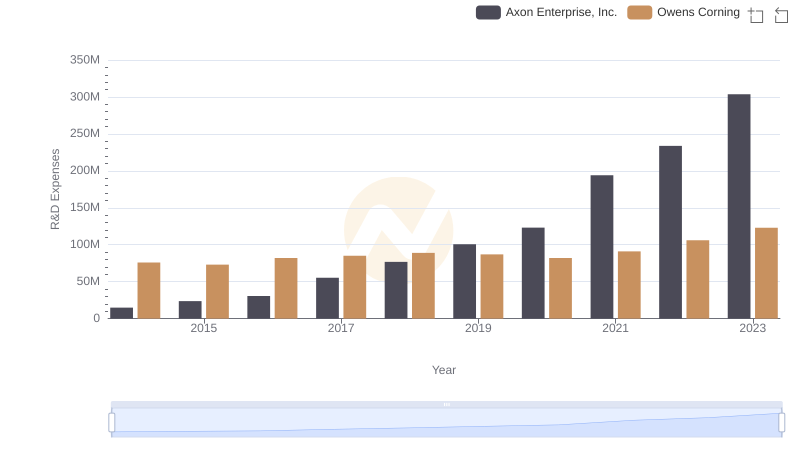
Research and Development Investment: Axon Enterprise, Inc. vs Owens Corning
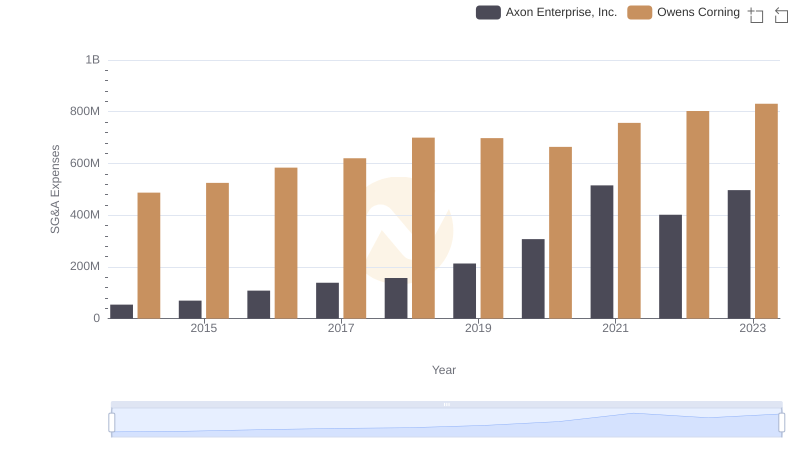
Comparing SG&A Expenses: Axon Enterprise, Inc. vs Owens Corning Trends and Insights