| __timestamp | AMETEK, Inc. | ITT Inc. |
|---|---|---|
| Wednesday, January 1, 2014 | 462637000 | 519500000 |
| Thursday, January 1, 2015 | 448592000 | 441500000 |
| Friday, January 1, 2016 | 462970000 | 444100000 |
| Sunday, January 1, 2017 | 533645000 | 433700000 |
| Monday, January 1, 2018 | 584022000 | 427300000 |
| Tuesday, January 1, 2019 | 610280000 | 420000000 |
| Wednesday, January 1, 2020 | 515630000 | 347200000 |
| Friday, January 1, 2021 | 603944000 | 365100000 |
| Saturday, January 1, 2022 | 644577000 | 368500000 |
| Sunday, January 1, 2023 | 677006000 | 476600000 |
| Monday, January 1, 2024 | 696905000 | 502300000 |
Data in motion
Over the past decade, AMETEK, Inc. and ITT Inc. have showcased intriguing trends in their Selling, General, and Administrative (SG&A) expenses. From 2014 to 2023, AMETEK's SG&A expenses have surged by approximately 46%, reflecting a robust growth trajectory. In contrast, ITT Inc. experienced a decline of about 8% over the same period, indicating a more conservative financial strategy.
In 2014, ITT Inc. led with higher SG&A expenses, but by 2023, AMETEK had overtaken, marking a significant shift in financial dynamics. Notably, AMETEK's expenses peaked in 2023, while ITT Inc. saw its lowest in 2020, highlighting differing responses to market conditions.
These trends suggest AMETEK's aggressive expansion and ITT's focus on efficiency. Investors and analysts should consider these patterns when evaluating future growth and profitability.
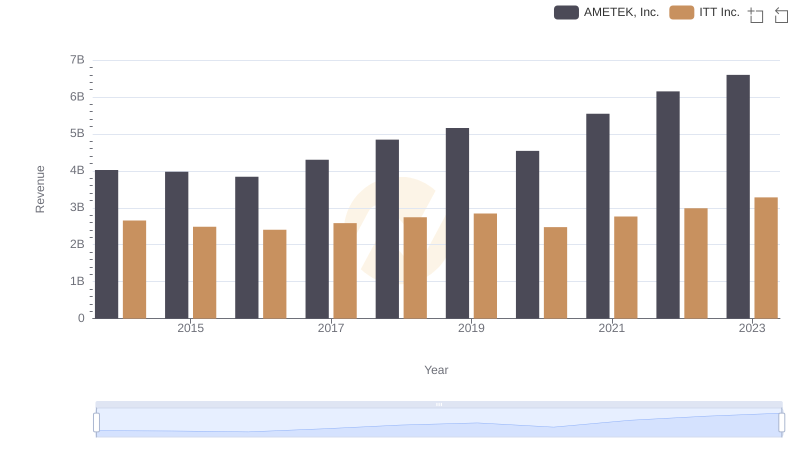
AMETEK, Inc. or ITT Inc.: Who Leads in Yearly Revenue?
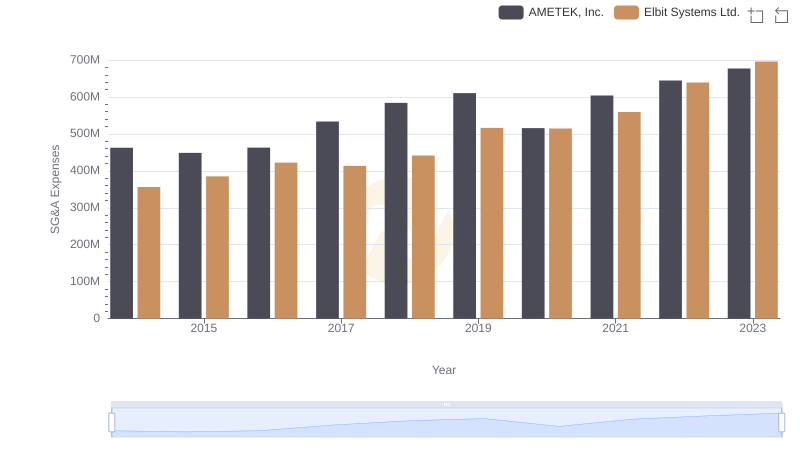
AMETEK, Inc. and Elbit Systems Ltd.: SG&A Spending Patterns Compared
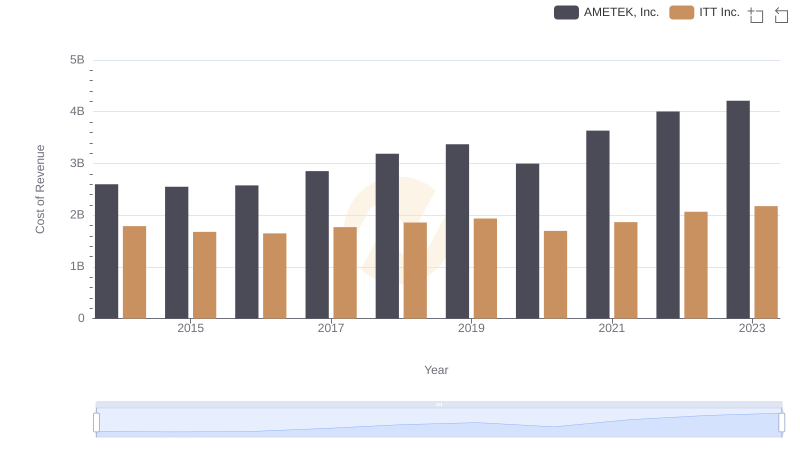
Cost of Revenue Trends: AMETEK, Inc. vs ITT Inc.
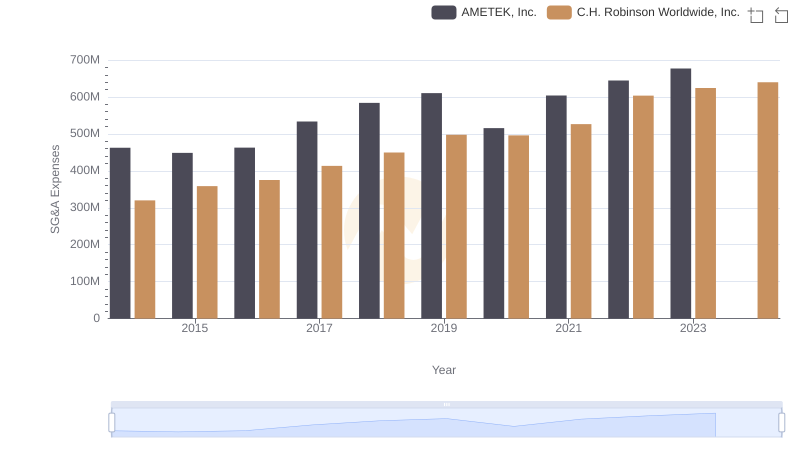
SG&A Efficiency Analysis: Comparing AMETEK, Inc. and C.H. Robinson Worldwide, Inc.
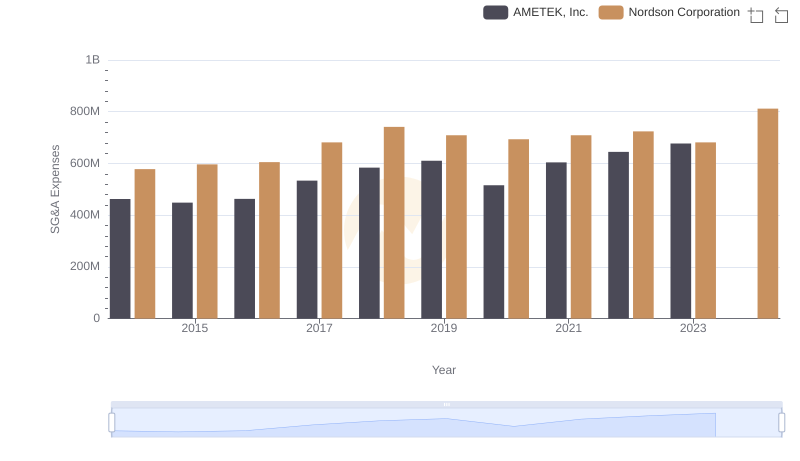
AMETEK, Inc. vs Nordson Corporation: SG&A Expense Trends
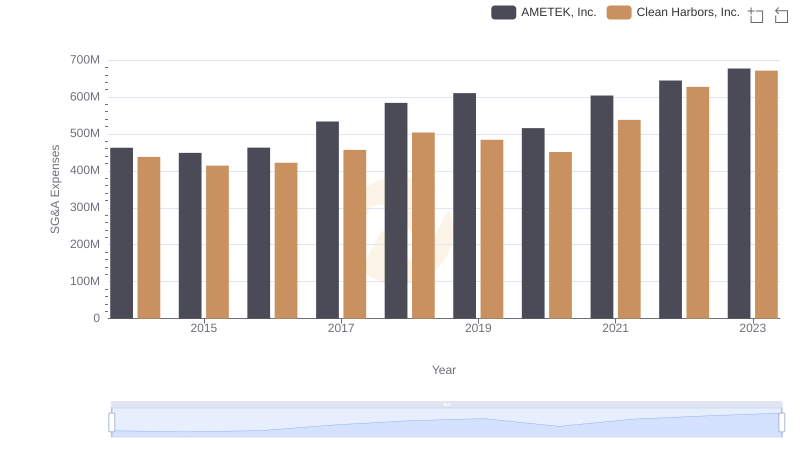
AMETEK, Inc. vs Clean Harbors, Inc.: SG&A Expense Trends
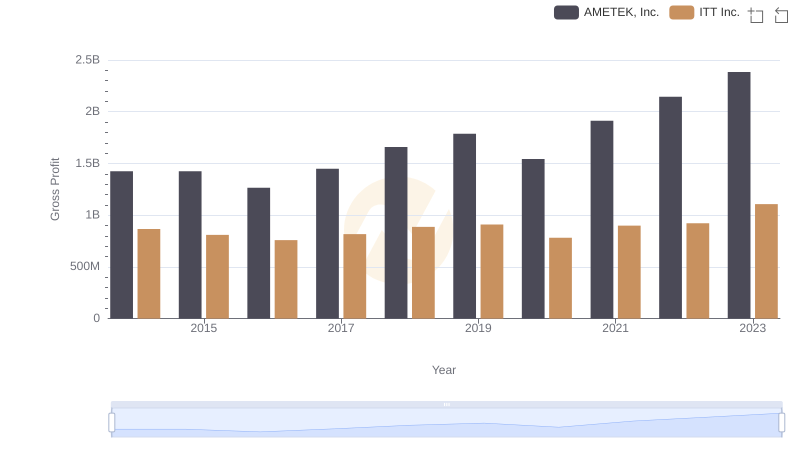
AMETEK, Inc. vs ITT Inc.: A Gross Profit Performance Breakdown
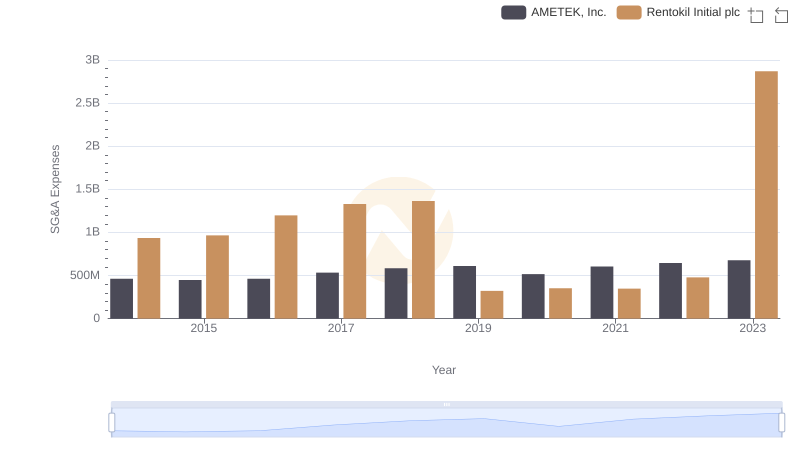
Selling, General, and Administrative Costs: AMETEK, Inc. vs Rentokil Initial plc
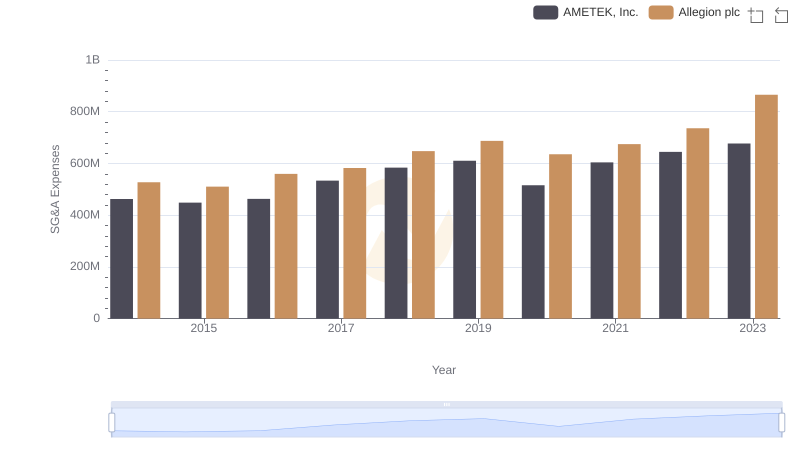
Comparing SG&A Expenses: AMETEK, Inc. vs Allegion plc Trends and Insights
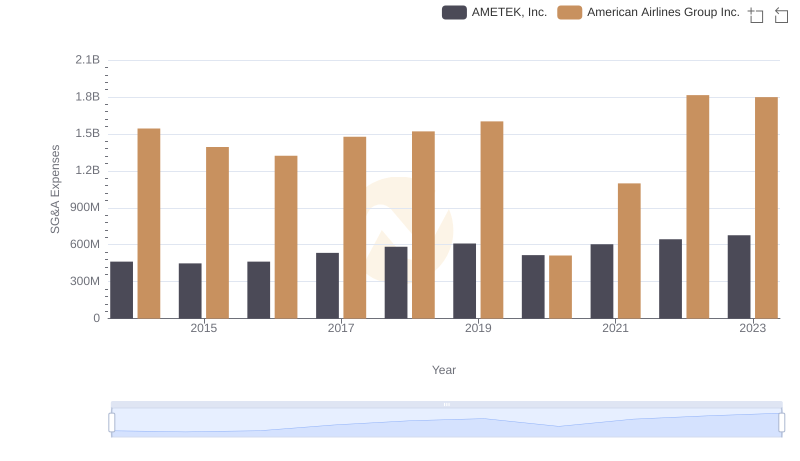
Comparing SG&A Expenses: AMETEK, Inc. vs American Airlines Group Inc. Trends and Insights
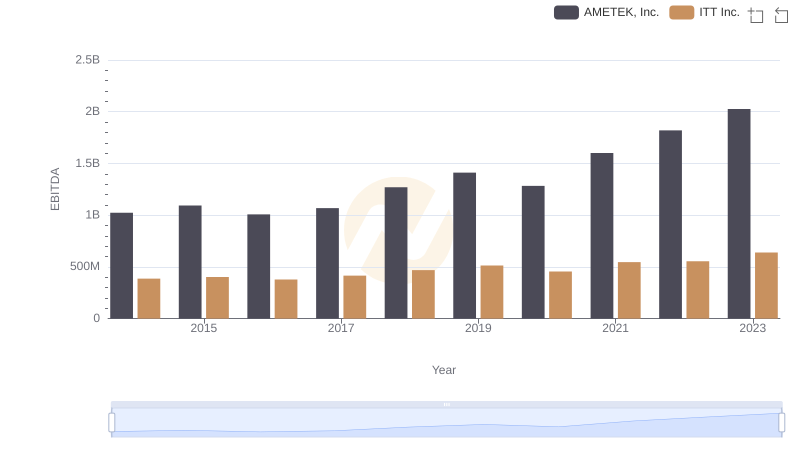
Comprehensive EBITDA Comparison: AMETEK, Inc. vs ITT Inc.