| __timestamp | AMETEK, Inc. | ITT Inc. |
|---|---|---|
| Wednesday, January 1, 2014 | 1023344000 | 386700000 |
| Thursday, January 1, 2015 | 1093776000 | 402700000 |
| Friday, January 1, 2016 | 1007213000 | 378000000 |
| Sunday, January 1, 2017 | 1068174000 | 415000000 |
| Monday, January 1, 2018 | 1269415000 | 469000000 |
| Tuesday, January 1, 2019 | 1411422000 | 513900000 |
| Wednesday, January 1, 2020 | 1283159000 | 455000000 |
| Friday, January 1, 2021 | 1600782000 | 545600000 |
| Saturday, January 1, 2022 | 1820119000 | 554500000 |
| Sunday, January 1, 2023 | 2025843000 | 639100000 |
| Monday, January 1, 2024 | 1779562000 | 821500000 |
Unlocking the unknown
In the ever-evolving landscape of industrial technology, AMETEK, Inc. and ITT Inc. have emerged as formidable players. Over the past decade, from 2014 to 2023, these companies have demonstrated significant growth in their Earnings Before Interest, Taxes, Depreciation, and Amortization (EBITDA), a key indicator of financial performance.
AMETEK, Inc. has shown a remarkable upward trajectory, with its EBITDA growing by approximately 98% over the period. Starting at around $1 billion in 2014, it reached a peak of over $2 billion by 2023. This consistent growth underscores AMETEK's strategic prowess in expanding its market footprint.
ITT Inc., while smaller in scale, has also experienced a healthy EBITDA increase of about 65%. From $387 million in 2014, it climbed to $639 million in 2023, reflecting its resilience and adaptability in a competitive market.
Both companies exemplify robust financial health, with AMETEK leading the charge in terms of absolute growth. This comparison not only highlights their individual successes but also offers insights into the broader industrial sector's dynamics.
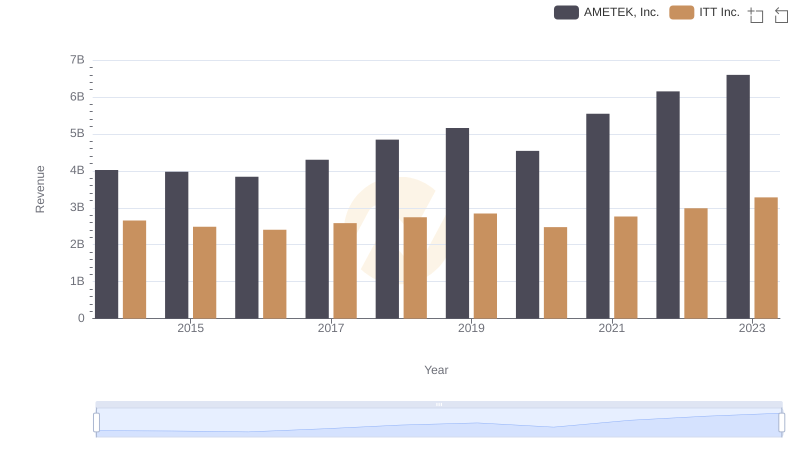
AMETEK, Inc. or ITT Inc.: Who Leads in Yearly Revenue?
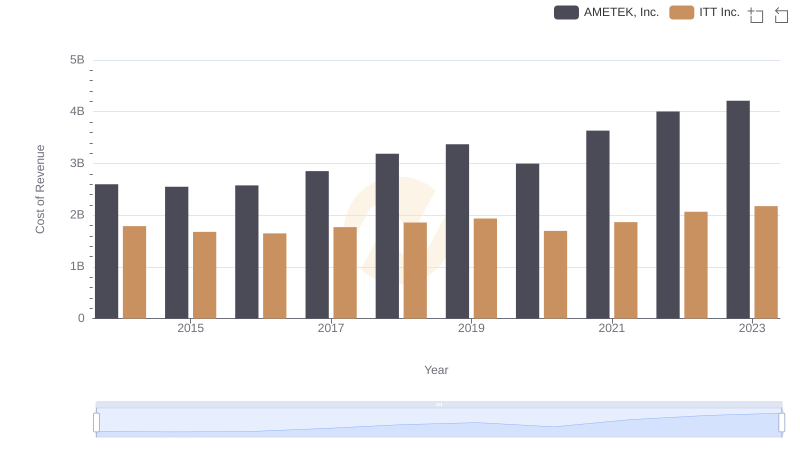
Cost of Revenue Trends: AMETEK, Inc. vs ITT Inc.
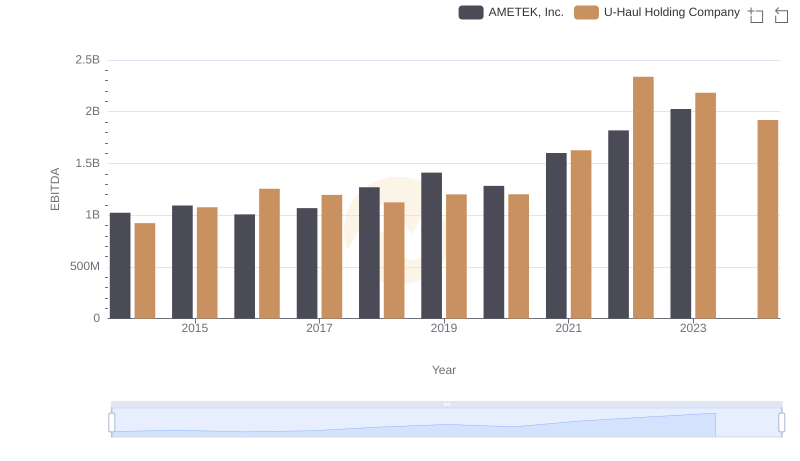
EBITDA Analysis: Evaluating AMETEK, Inc. Against U-Haul Holding Company
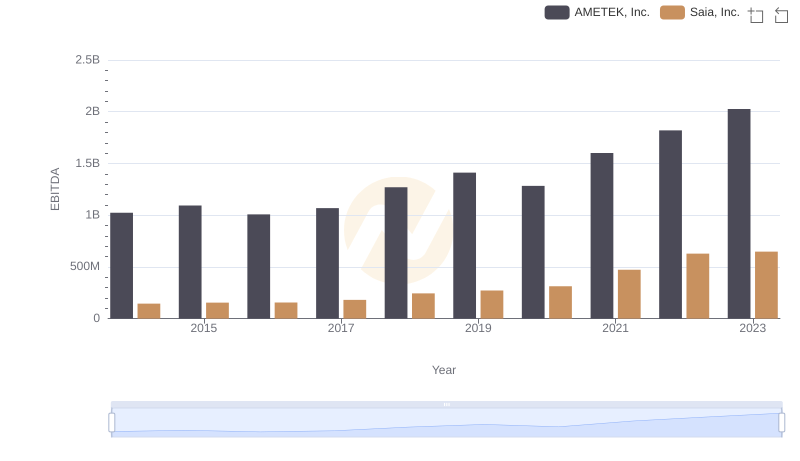
AMETEK, Inc. vs Saia, Inc.: In-Depth EBITDA Performance Comparison
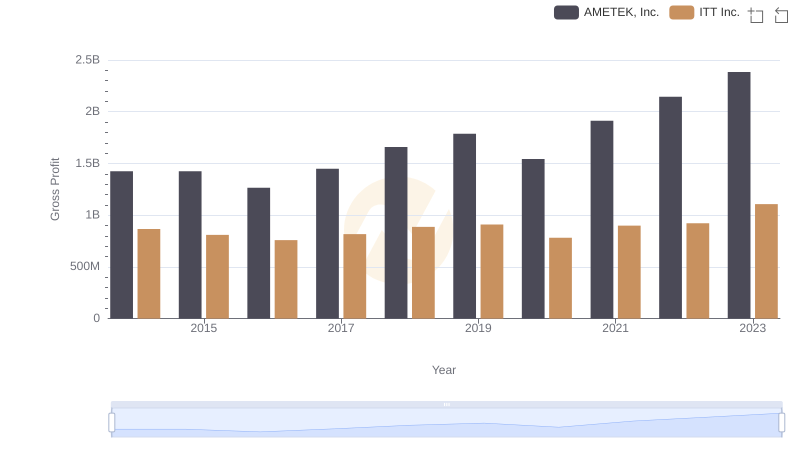
AMETEK, Inc. vs ITT Inc.: A Gross Profit Performance Breakdown
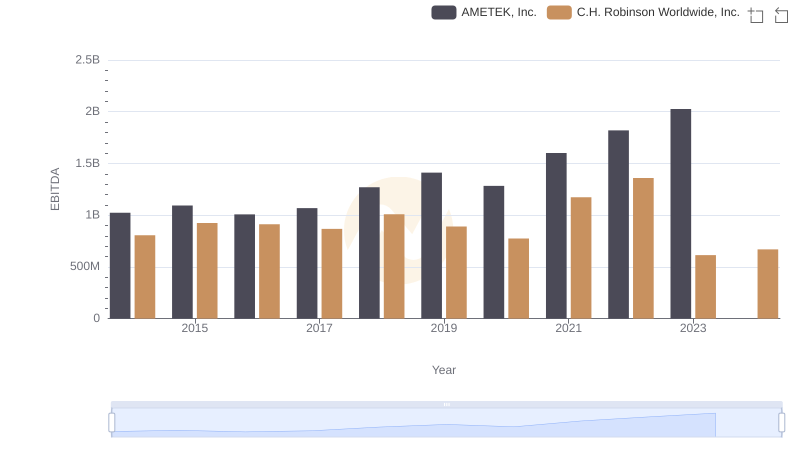
Professional EBITDA Benchmarking: AMETEK, Inc. vs C.H. Robinson Worldwide, Inc.
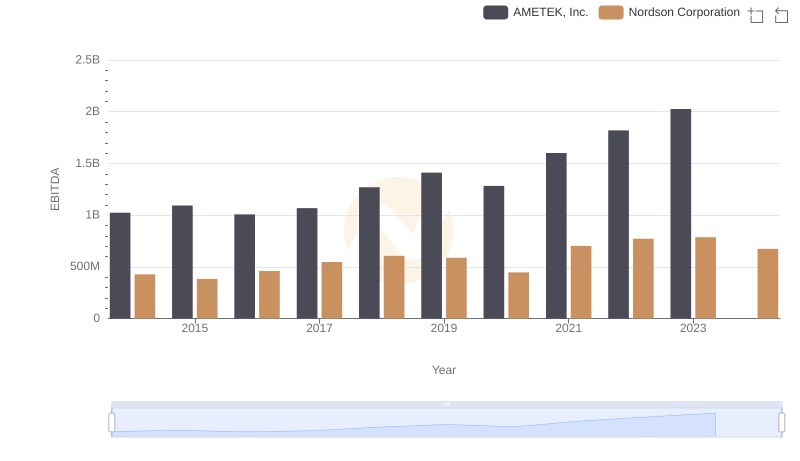
Comparative EBITDA Analysis: AMETEK, Inc. vs Nordson Corporation
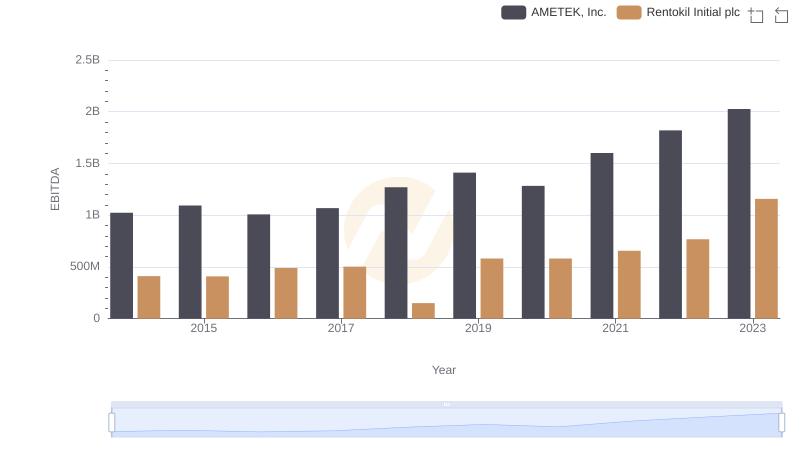
Comparative EBITDA Analysis: AMETEK, Inc. vs Rentokil Initial plc
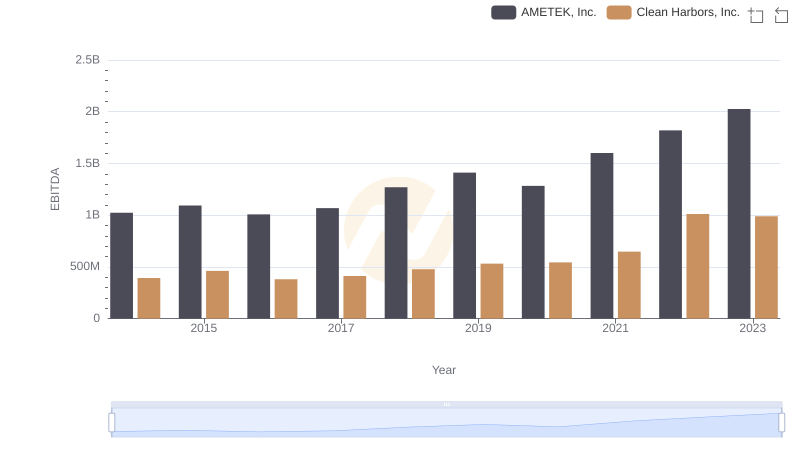
EBITDA Performance Review: AMETEK, Inc. vs Clean Harbors, Inc.
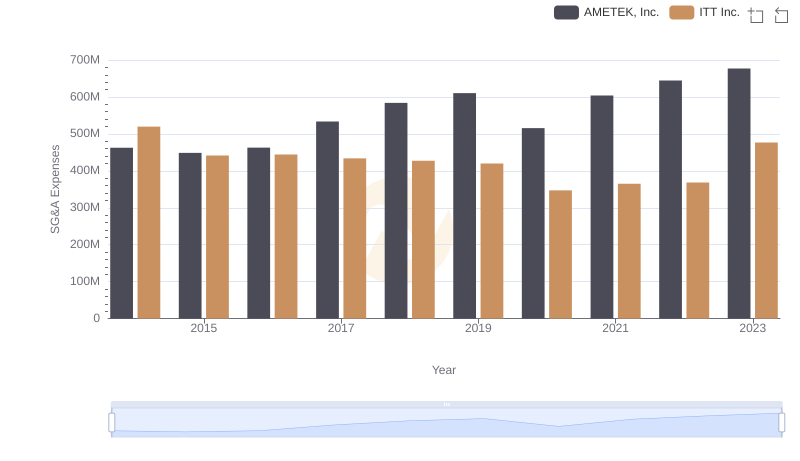
Comparing SG&A Expenses: AMETEK, Inc. vs ITT Inc. Trends and Insights
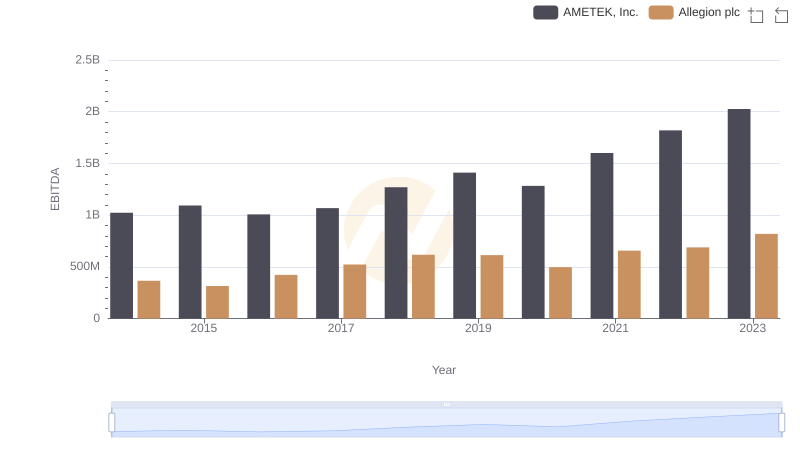
EBITDA Metrics Evaluated: AMETEK, Inc. vs Allegion plc