| __timestamp | AMETEK, Inc. | Elbit Systems Ltd. |
|---|---|---|
| Wednesday, January 1, 2014 | 462637000 | 356171000 |
| Thursday, January 1, 2015 | 448592000 | 385059000 |
| Friday, January 1, 2016 | 462970000 | 422390000 |
| Sunday, January 1, 2017 | 533645000 | 413560000 |
| Monday, January 1, 2018 | 584022000 | 441362000 |
| Tuesday, January 1, 2019 | 610280000 | 516149000 |
| Wednesday, January 1, 2020 | 515630000 | 514638000 |
| Friday, January 1, 2021 | 603944000 | 559113000 |
| Saturday, January 1, 2022 | 644577000 | 639067000 |
| Sunday, January 1, 2023 | 677006000 | 696022000 |
| Monday, January 1, 2024 | 696905000 |
Unveiling the hidden dimensions of data
In the competitive landscape of global industries, understanding the financial strategies of leading companies is crucial. AMETEK, Inc. and Elbit Systems Ltd. offer a fascinating study in contrasting SG&A (Selling, General, and Administrative) expense trends over the past decade. From 2014 to 2023, AMETEK's SG&A expenses grew by approximately 46%, reflecting a strategic investment in operational efficiency and market expansion. Meanwhile, Elbit Systems Ltd. saw a remarkable 95% increase, indicating a robust focus on scaling and innovation.
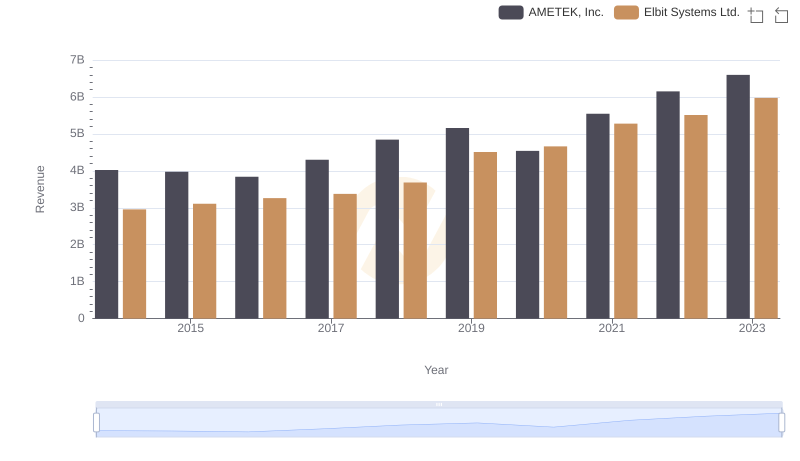
Revenue Insights: AMETEK, Inc. and Elbit Systems Ltd. Performance Compared
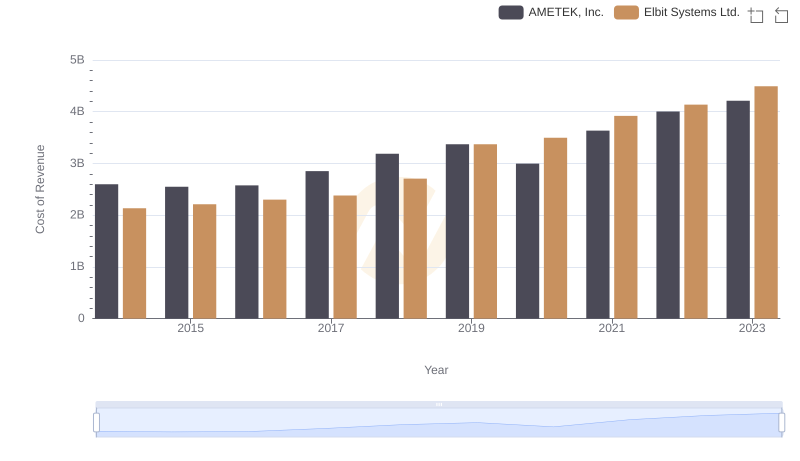
Cost of Revenue Comparison: AMETEK, Inc. vs Elbit Systems Ltd.
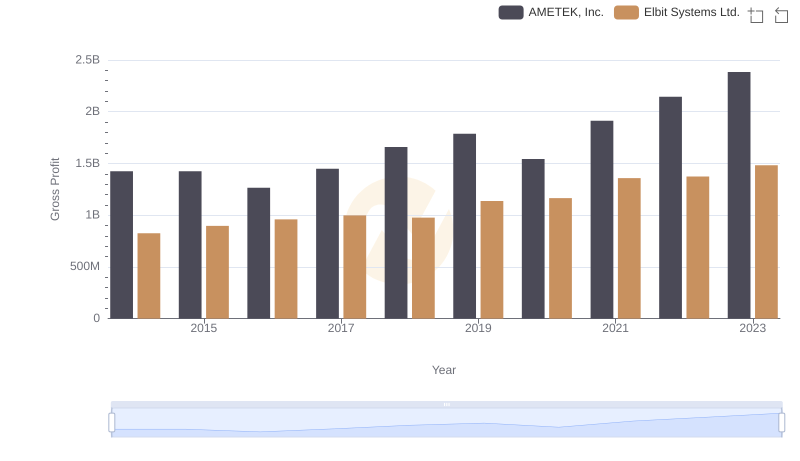
Key Insights on Gross Profit: AMETEK, Inc. vs Elbit Systems Ltd.
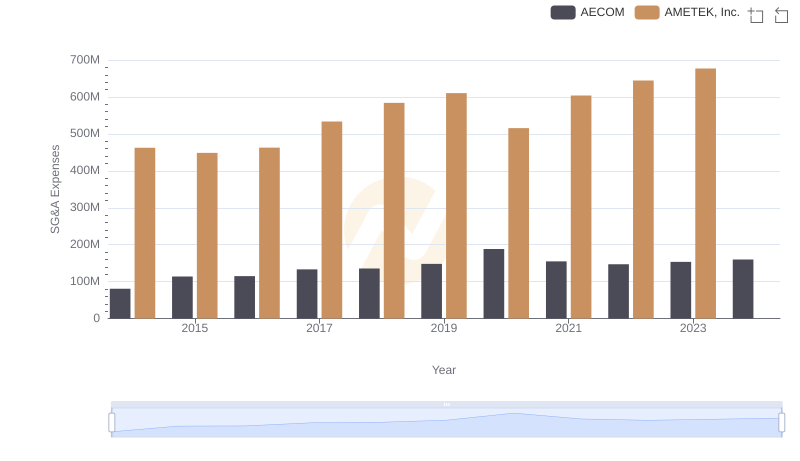
SG&A Efficiency Analysis: Comparing AMETEK, Inc. and AECOM
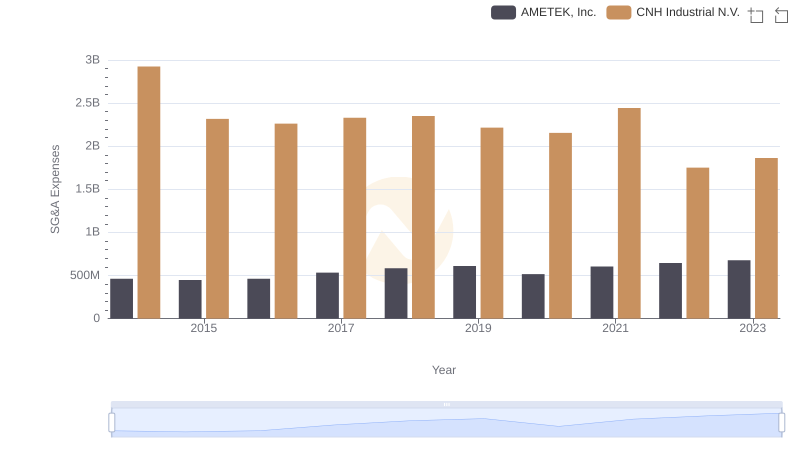
Who Optimizes SG&A Costs Better? AMETEK, Inc. or CNH Industrial N.V.
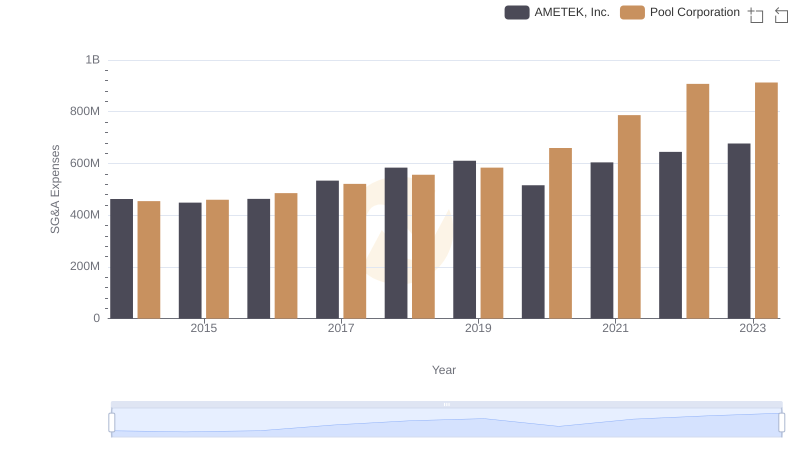
Cost Management Insights: SG&A Expenses for AMETEK, Inc. and Pool Corporation
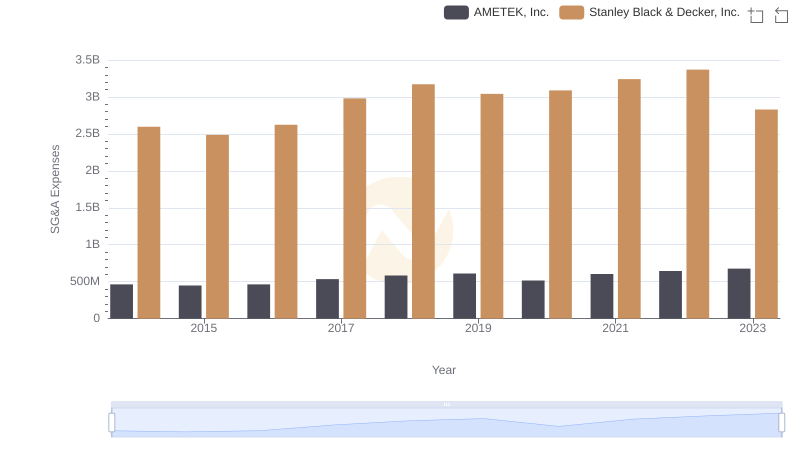
AMETEK, Inc. and Stanley Black & Decker, Inc.: SG&A Spending Patterns Compared
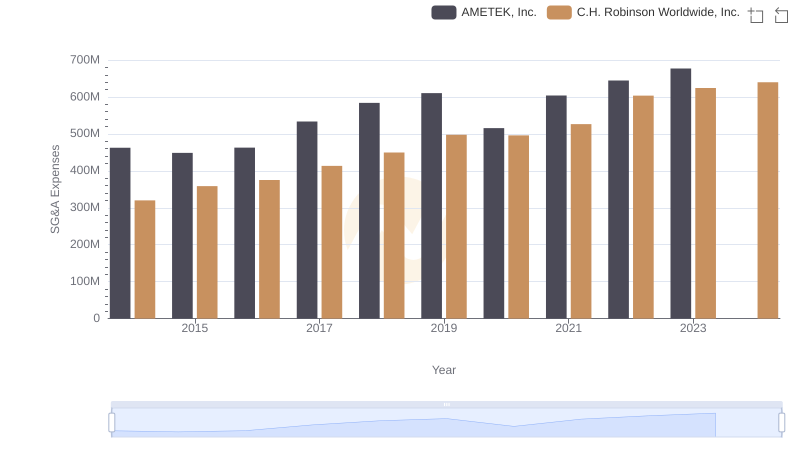
SG&A Efficiency Analysis: Comparing AMETEK, Inc. and C.H. Robinson Worldwide, Inc.
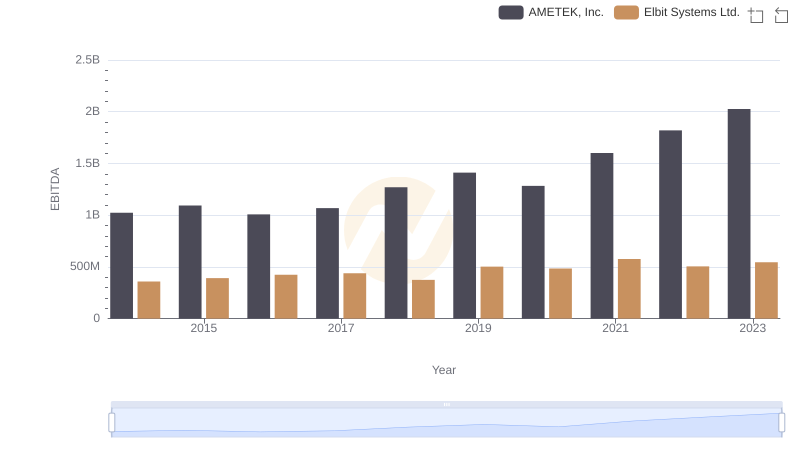
EBITDA Metrics Evaluated: AMETEK, Inc. vs Elbit Systems Ltd.
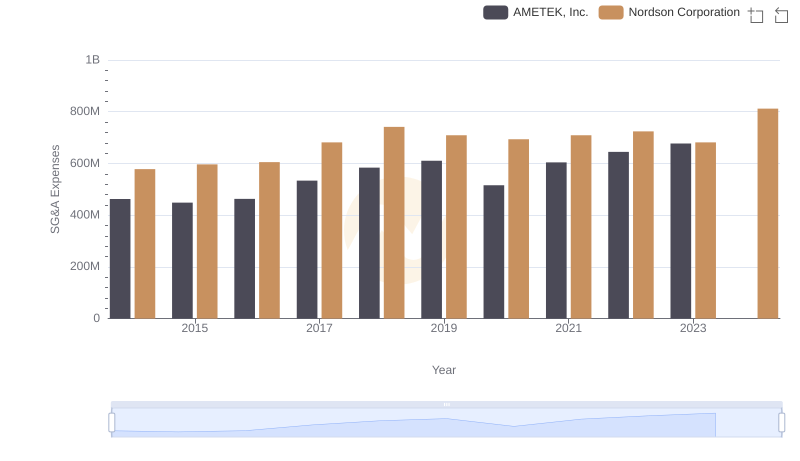
AMETEK, Inc. vs Nordson Corporation: SG&A Expense Trends