| __timestamp | AMETEK, Inc. | American Airlines Group Inc. |
|---|---|---|
| Wednesday, January 1, 2014 | 462637000 | 1544000000 |
| Thursday, January 1, 2015 | 448592000 | 1394000000 |
| Friday, January 1, 2016 | 462970000 | 1323000000 |
| Sunday, January 1, 2017 | 533645000 | 1477000000 |
| Monday, January 1, 2018 | 584022000 | 1520000000 |
| Tuesday, January 1, 2019 | 610280000 | 1602000000 |
| Wednesday, January 1, 2020 | 515630000 | 513000000 |
| Friday, January 1, 2021 | 603944000 | 1098000000 |
| Saturday, January 1, 2022 | 644577000 | 1815000000 |
| Sunday, January 1, 2023 | 677006000 | 1799000000 |
| Monday, January 1, 2024 | 696905000 |
Unlocking the unknown
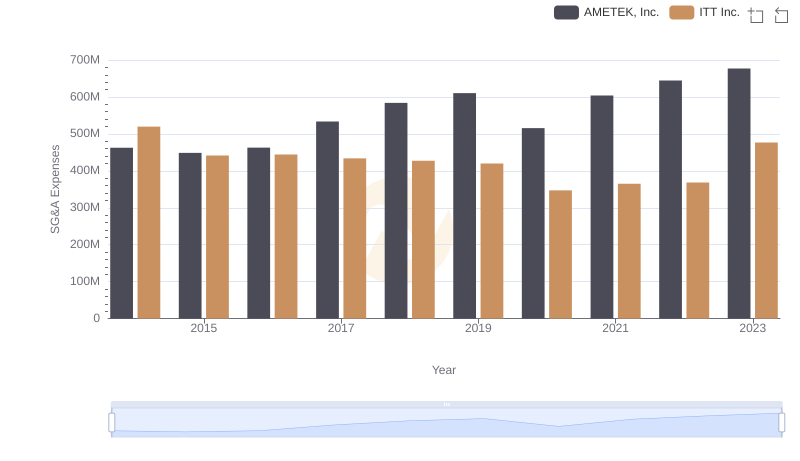
In the ever-evolving landscape of corporate finance, Selling, General, and Administrative (SG&A) expenses serve as a critical indicator of operational efficiency. This analysis juxtaposes the SG&A trends of AMETEK, Inc., a leader in electronic instruments, against American Airlines Group Inc., a titan in the aviation sector, from 2014 to 2023.
AMETEK, Inc. has demonstrated a steady increase in SG&A expenses, peaking at approximately 677 million in 2023, marking a 46% rise from 2014. In contrast, American Airlines experienced a more volatile trajectory, with a significant dip in 2020, likely due to the pandemic's impact on travel, before rebounding to nearly 1.8 billion in 2023. This represents a 17% increase from 2014.
These trends highlight the resilience and adaptability of these companies in their respective industries, offering valuable insights for investors and analysts alike.
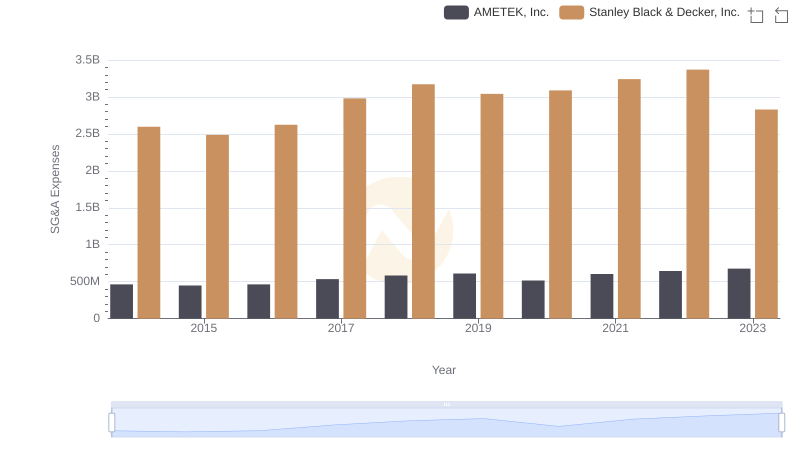
AMETEK, Inc. and Stanley Black & Decker, Inc.: SG&A Spending Patterns Compared
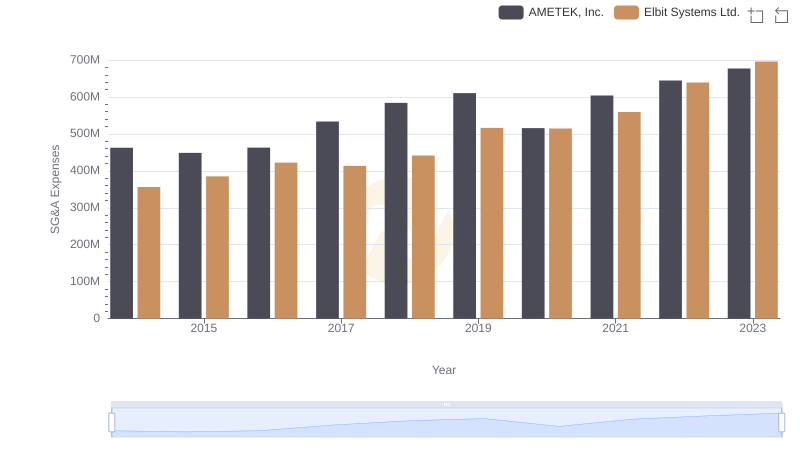
AMETEK, Inc. and Elbit Systems Ltd.: SG&A Spending Patterns Compared
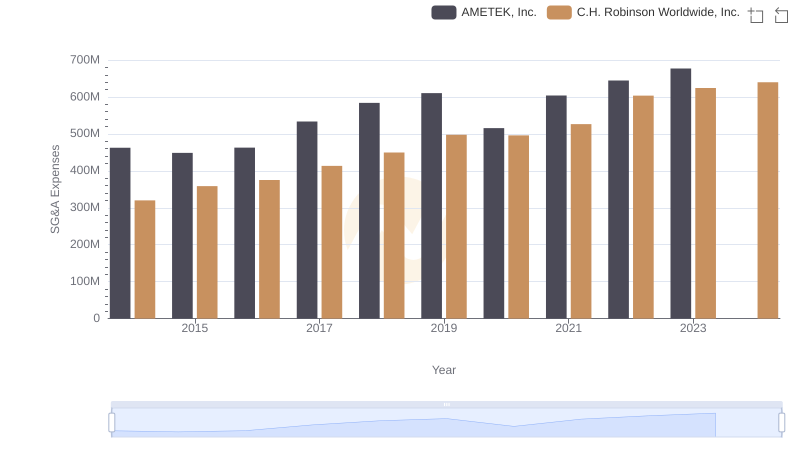
SG&A Efficiency Analysis: Comparing AMETEK, Inc. and C.H. Robinson Worldwide, Inc.
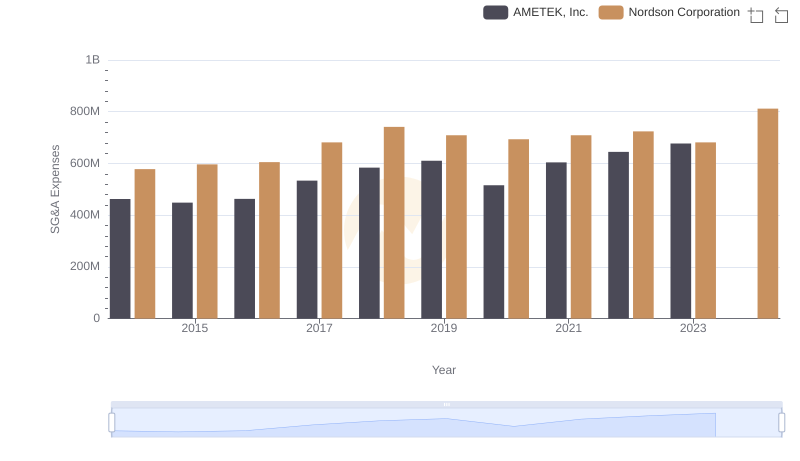
AMETEK, Inc. vs Nordson Corporation: SG&A Expense Trends
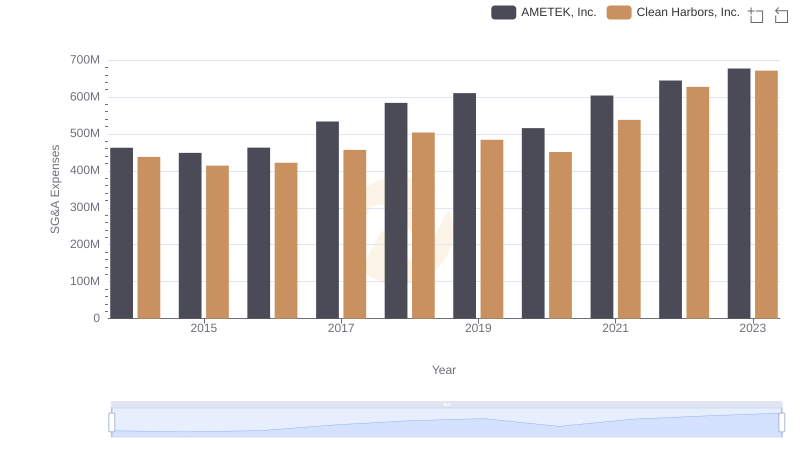
AMETEK, Inc. vs Clean Harbors, Inc.: SG&A Expense Trends
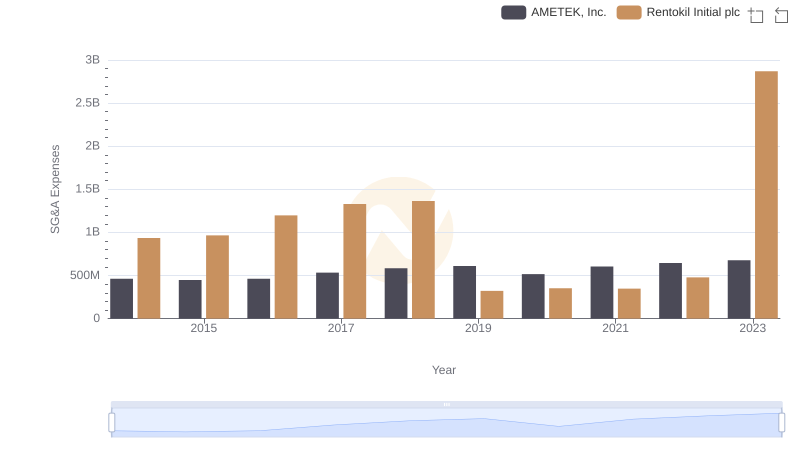
Selling, General, and Administrative Costs: AMETEK, Inc. vs Rentokil Initial plc
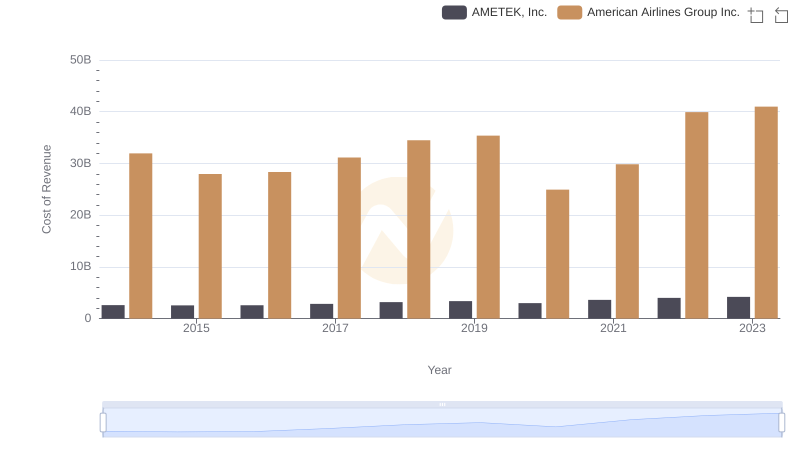
Cost Insights: Breaking Down AMETEK, Inc. and American Airlines Group Inc.'s Expenses
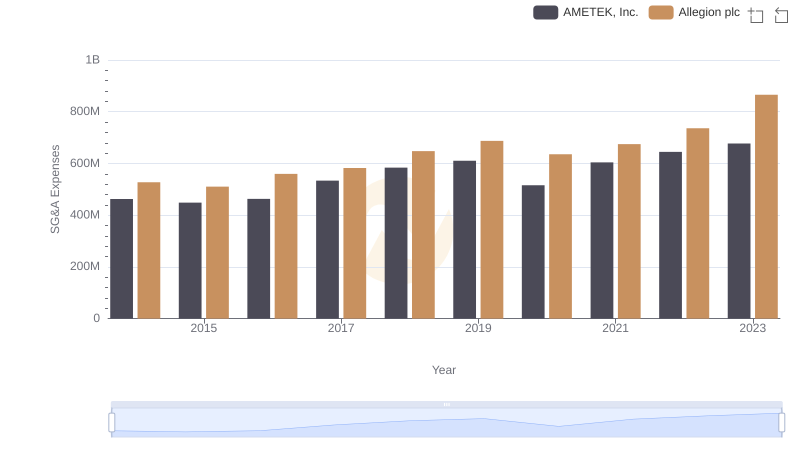
Comparing SG&A Expenses: AMETEK, Inc. vs Allegion plc Trends and Insights
Comparing SG&A Expenses: AMETEK, Inc. vs ITT Inc. Trends and Insights