| __timestamp | AMETEK, Inc. | Rentokil Initial plc |
|---|---|---|
| Wednesday, January 1, 2014 | 462637000 | 935700000 |
| Thursday, January 1, 2015 | 448592000 | 965700000 |
| Friday, January 1, 2016 | 462970000 | 1197600000 |
| Sunday, January 1, 2017 | 533645000 | 1329600000 |
| Monday, January 1, 2018 | 584022000 | 1364000000 |
| Tuesday, January 1, 2019 | 610280000 | 322500000 |
| Wednesday, January 1, 2020 | 515630000 | 352000000 |
| Friday, January 1, 2021 | 603944000 | 348600000 |
| Saturday, January 1, 2022 | 644577000 | 479000000 |
| Sunday, January 1, 2023 | 677006000 | 2870000000 |
| Monday, January 1, 2024 | 696905000 |
Cracking the code
In the world of corporate finance, Selling, General, and Administrative (SG&A) expenses are a crucial indicator of a company's operational efficiency. Over the past decade, AMETEK, Inc. and Rentokil Initial plc have shown contrasting trends in their SG&A expenses. From 2014 to 2023, AMETEK's expenses grew steadily by approximately 46%, reflecting a consistent investment in operational capabilities. In contrast, Rentokil Initial plc experienced a more volatile journey, with a staggering 200% increase in 2023 compared to 2014, highlighting strategic expansions and acquisitions.
These trends offer a fascinating glimpse into how different strategic approaches impact financial outcomes over time.
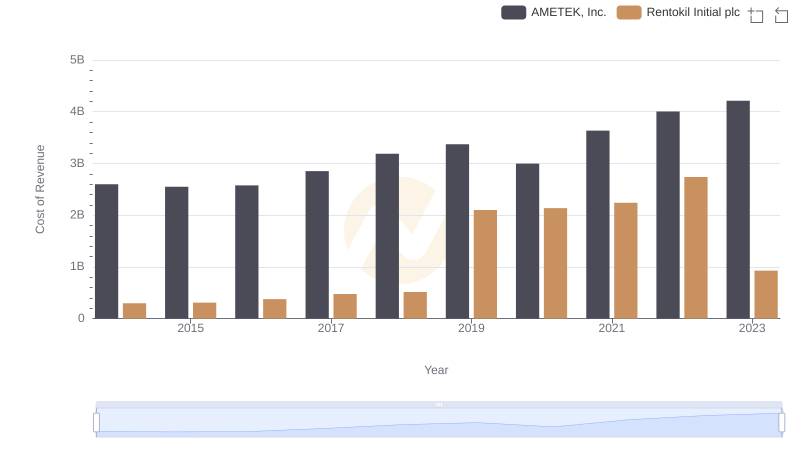
Cost Insights: Breaking Down AMETEK, Inc. and Rentokil Initial plc's Expenses
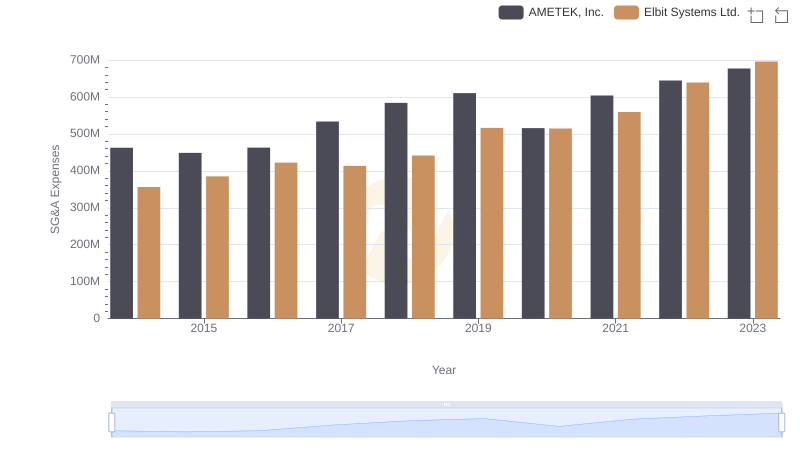
AMETEK, Inc. and Elbit Systems Ltd.: SG&A Spending Patterns Compared
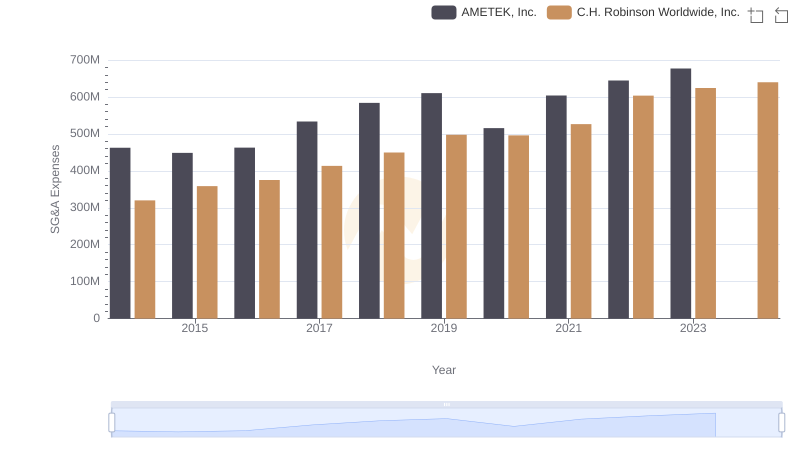
SG&A Efficiency Analysis: Comparing AMETEK, Inc. and C.H. Robinson Worldwide, Inc.
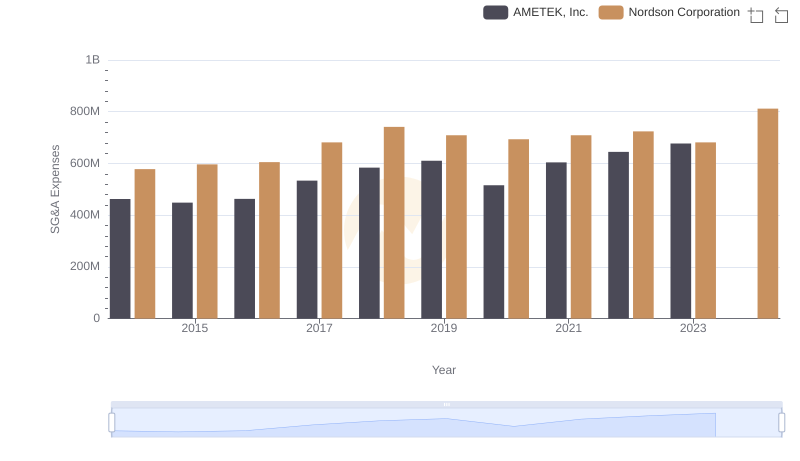
AMETEK, Inc. vs Nordson Corporation: SG&A Expense Trends
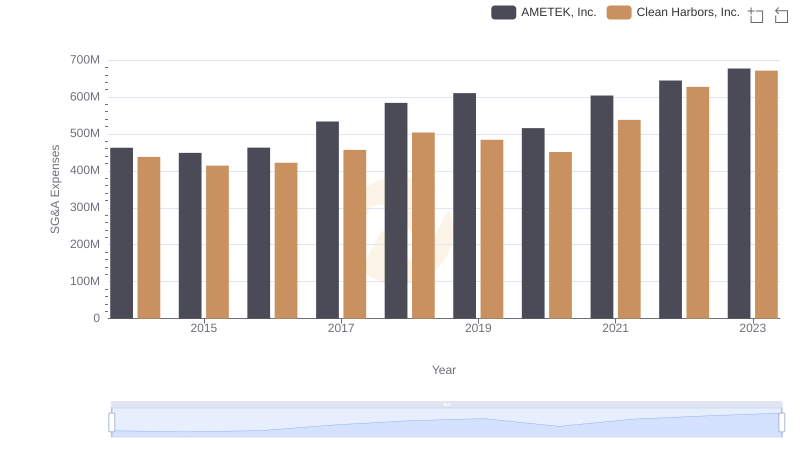
AMETEK, Inc. vs Clean Harbors, Inc.: SG&A Expense Trends
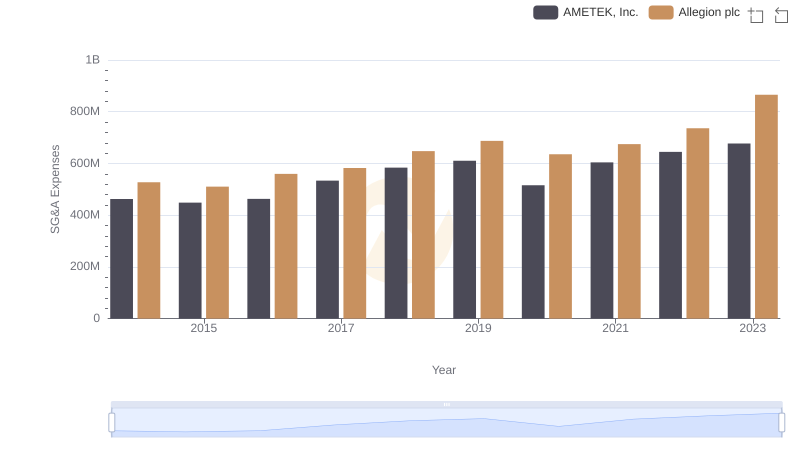
Comparing SG&A Expenses: AMETEK, Inc. vs Allegion plc Trends and Insights
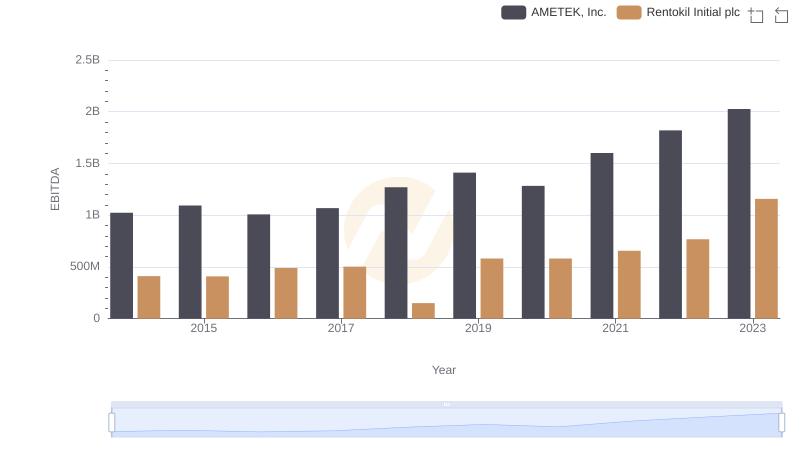
Comparative EBITDA Analysis: AMETEK, Inc. vs Rentokil Initial plc
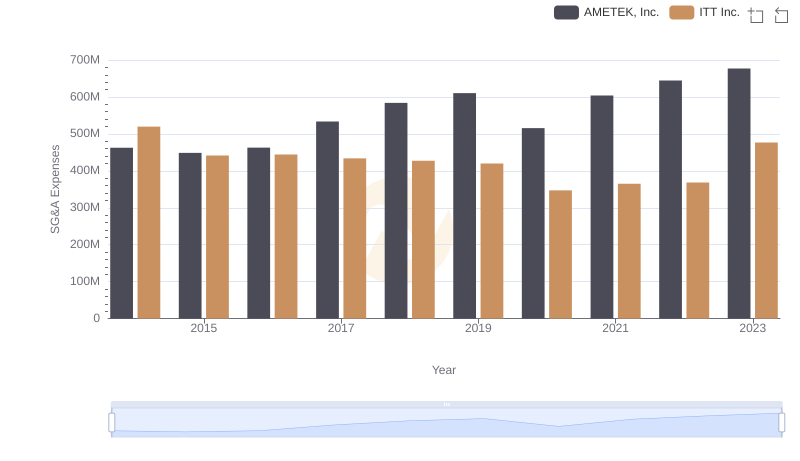
Comparing SG&A Expenses: AMETEK, Inc. vs ITT Inc. Trends and Insights
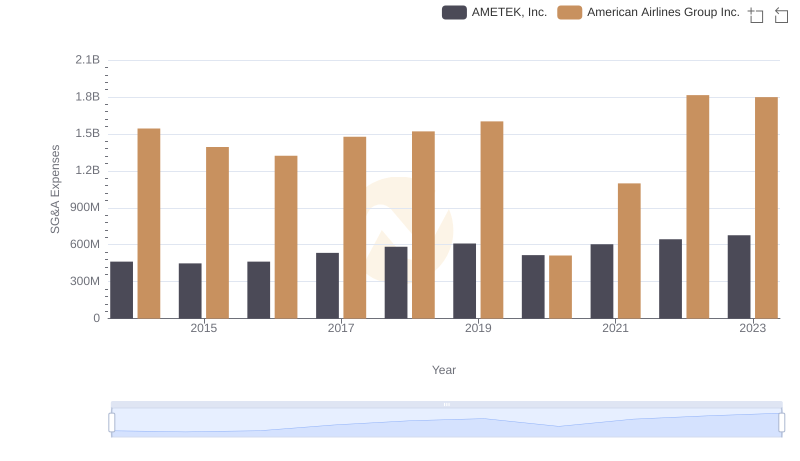
Comparing SG&A Expenses: AMETEK, Inc. vs American Airlines Group Inc. Trends and Insights