| __timestamp | AMETEK, Inc. | ITT Inc. |
|---|---|---|
| Wednesday, January 1, 2014 | 4021964000 | 2654600000 |
| Thursday, January 1, 2015 | 3974295000 | 2485600000 |
| Friday, January 1, 2016 | 3840087000 | 2405400000 |
| Sunday, January 1, 2017 | 4300170000 | 2585300000 |
| Monday, January 1, 2018 | 4845872000 | 2745100000 |
| Tuesday, January 1, 2019 | 5158557000 | 2846400000 |
| Wednesday, January 1, 2020 | 4540029000 | 2477800000 |
| Friday, January 1, 2021 | 5546514000 | 2765000000 |
| Saturday, January 1, 2022 | 6150530000 | 2987700000 |
| Sunday, January 1, 2023 | 6596950000 | 3283000000 |
| Monday, January 1, 2024 | 6941180000 | 3630700000 |
Infusing magic into the data realm
In the competitive landscape of industrial manufacturing, AMETEK, Inc. and ITT Inc. have been vying for dominance in yearly revenue since 2014. Over the past decade, AMETEK has consistently outperformed ITT, showcasing a robust growth trajectory. By 2023, AMETEK's revenue surged by approximately 64% from its 2014 figures, reaching a peak of $6.6 billion. In contrast, ITT's revenue grew by about 24% over the same period, culminating in $3.3 billion.
AMETEK's revenue growth has been particularly impressive, with a notable spike in 2021, where it increased by 22% compared to the previous year. This growth can be attributed to strategic acquisitions and a focus on high-margin products. Meanwhile, ITT has maintained a steady, albeit slower, growth rate, reflecting its stable market position.
As these industrial giants continue to innovate, the revenue race remains a captivating narrative for investors and industry watchers alike.
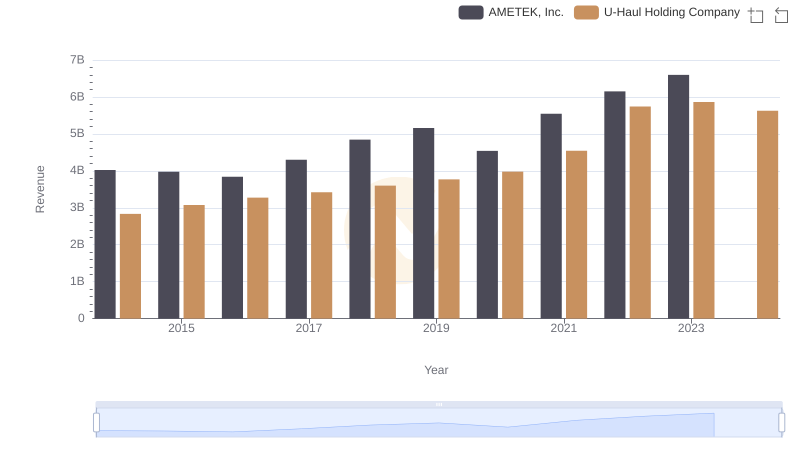
AMETEK, Inc. vs U-Haul Holding Company: Annual Revenue Growth Compared
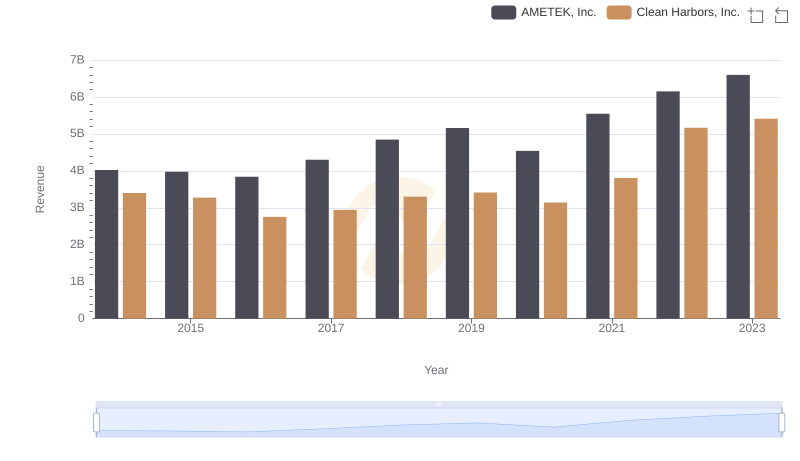
Revenue Showdown: AMETEK, Inc. vs Clean Harbors, Inc.
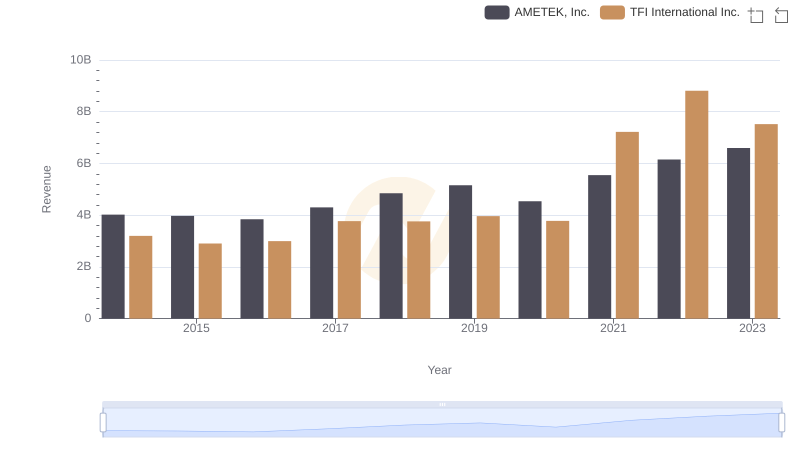
AMETEK, Inc. vs TFI International Inc.: Examining Key Revenue Metrics
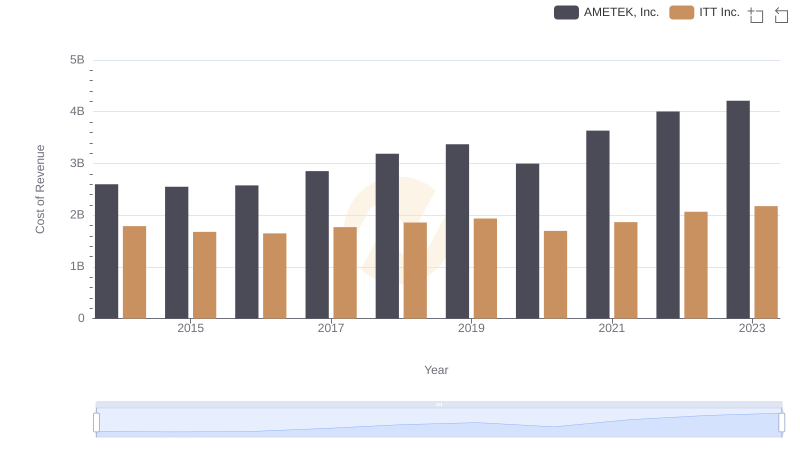
Cost of Revenue Trends: AMETEK, Inc. vs ITT Inc.
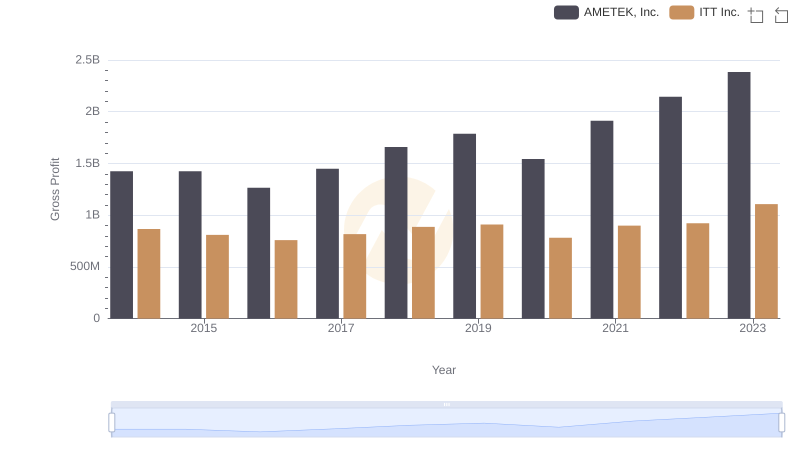
AMETEK, Inc. vs ITT Inc.: A Gross Profit Performance Breakdown
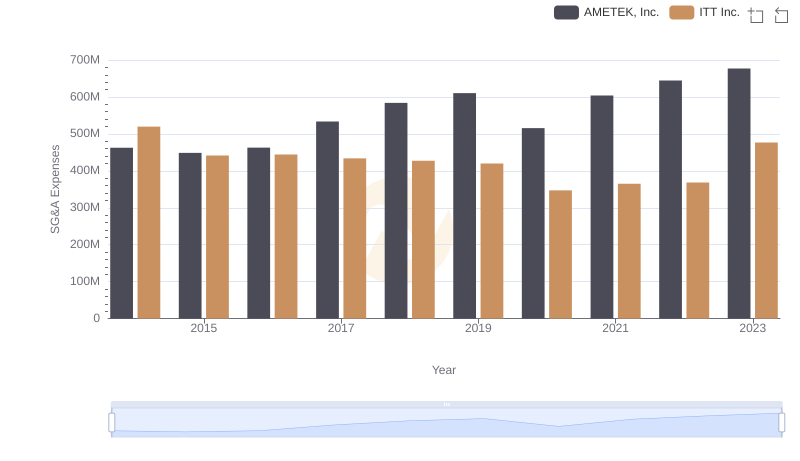
Comparing SG&A Expenses: AMETEK, Inc. vs ITT Inc. Trends and Insights
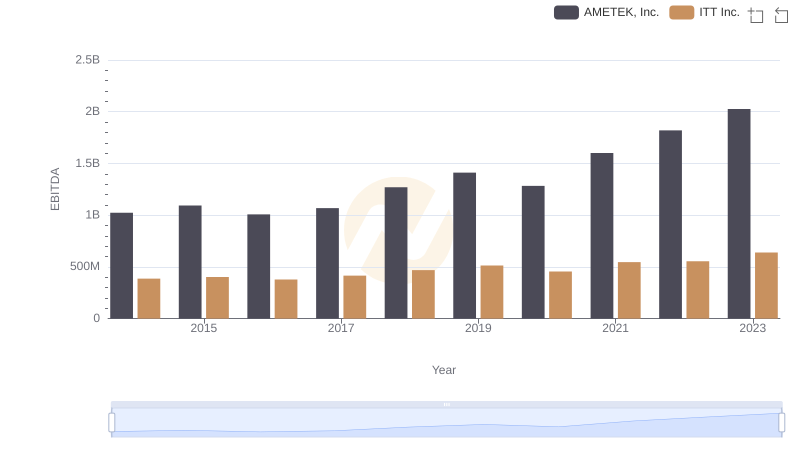
Comprehensive EBITDA Comparison: AMETEK, Inc. vs ITT Inc.