| __timestamp | AMETEK, Inc. | ITT Inc. |
|---|---|---|
| Wednesday, January 1, 2014 | 2597017000 | 1788200000 |
| Thursday, January 1, 2015 | 2549280000 | 1676500000 |
| Friday, January 1, 2016 | 2575220000 | 1647200000 |
| Sunday, January 1, 2017 | 2851431000 | 1768100000 |
| Monday, January 1, 2018 | 3186310000 | 1857900000 |
| Tuesday, January 1, 2019 | 3370897000 | 1936300000 |
| Wednesday, January 1, 2020 | 2996515000 | 1695600000 |
| Friday, January 1, 2021 | 3633900000 | 1865500000 |
| Saturday, January 1, 2022 | 4005261000 | 2065400000 |
| Sunday, January 1, 2023 | 4212484999 | 2175700000 |
| Monday, January 1, 2024 | 0 | 2383400000 |
Infusing magic into the data realm
In the competitive landscape of industrial manufacturing, AMETEK, Inc. and ITT Inc. have showcased intriguing cost of revenue trends over the past decade. From 2014 to 2023, AMETEK, Inc. has seen a robust increase in its cost of revenue, growing by approximately 62%, from $2.6 billion to $4.2 billion. This upward trajectory reflects AMETEK's expanding operations and market reach. In contrast, ITT Inc. has experienced a more modest growth of around 22%, with its cost of revenue rising from $1.8 billion to $2.2 billion. This difference highlights AMETEK's aggressive growth strategy compared to ITT's more conservative approach. The data underscores the dynamic nature of the industrial sector, where strategic decisions significantly impact financial outcomes. As these companies continue to evolve, their cost management strategies will be pivotal in shaping their future market positions.
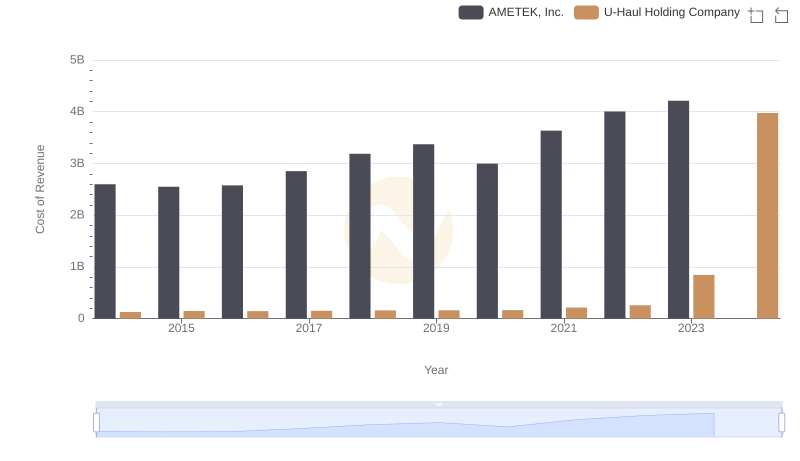
Comparing Cost of Revenue Efficiency: AMETEK, Inc. vs U-Haul Holding Company
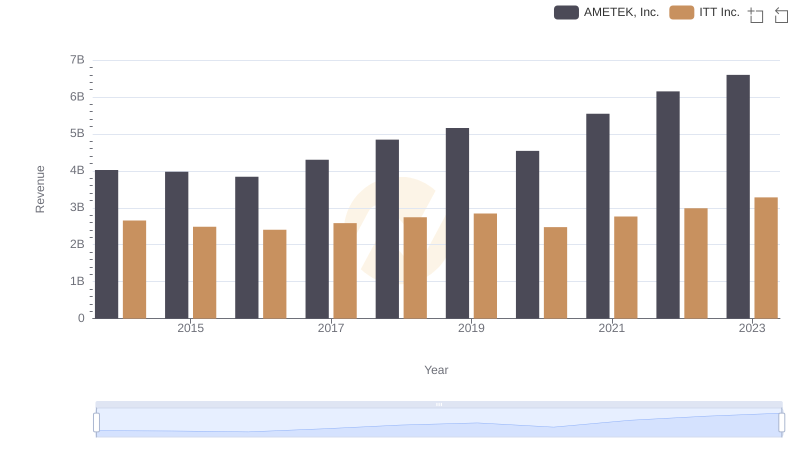
AMETEK, Inc. or ITT Inc.: Who Leads in Yearly Revenue?
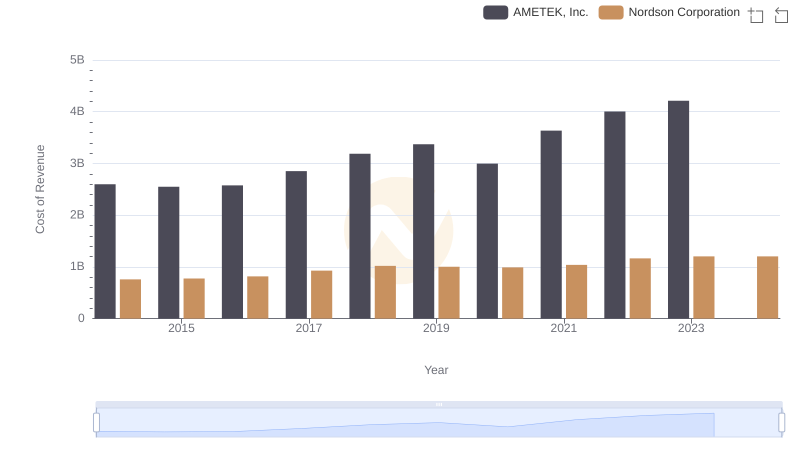
Analyzing Cost of Revenue: AMETEK, Inc. and Nordson Corporation
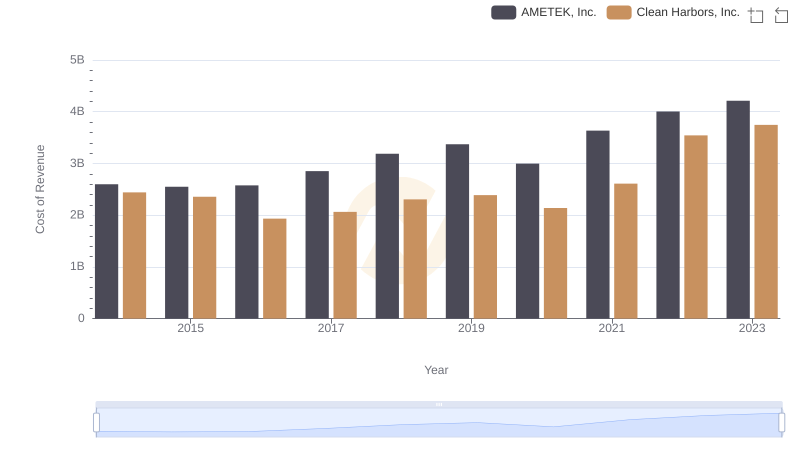
Analyzing Cost of Revenue: AMETEK, Inc. and Clean Harbors, Inc.
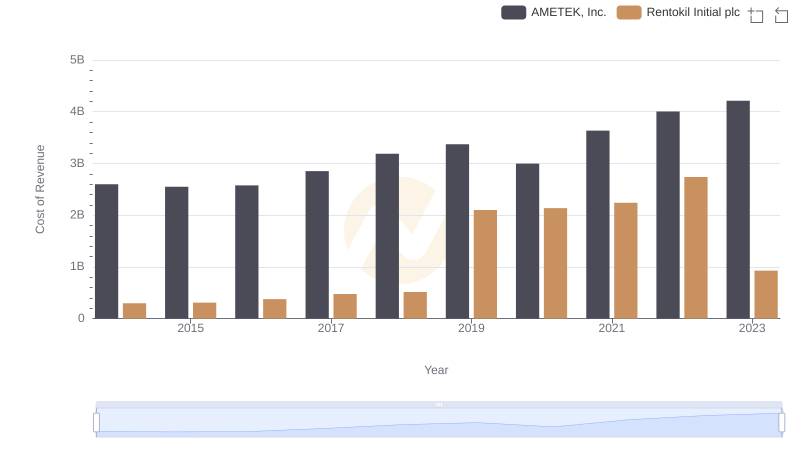
Cost Insights: Breaking Down AMETEK, Inc. and Rentokil Initial plc's Expenses
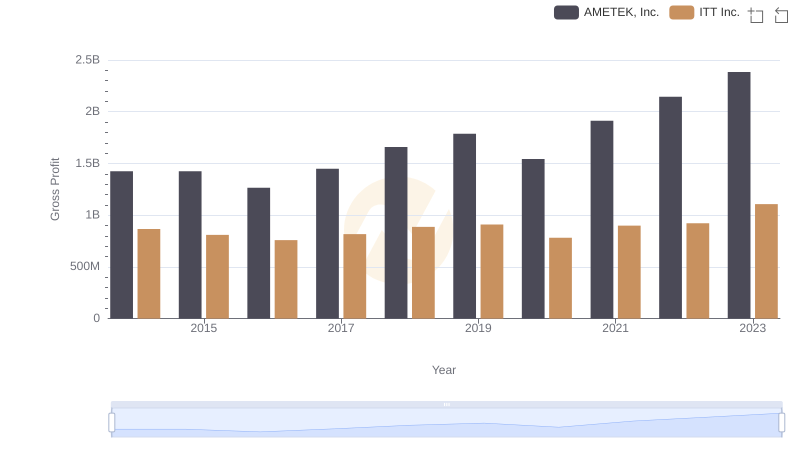
AMETEK, Inc. vs ITT Inc.: A Gross Profit Performance Breakdown
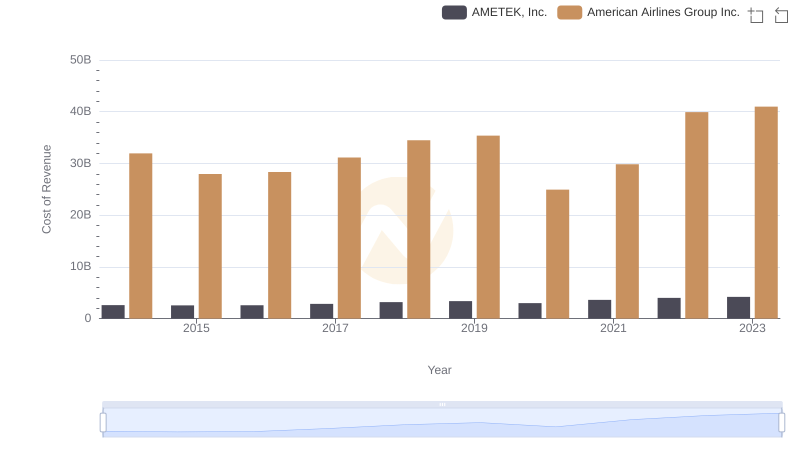
Cost Insights: Breaking Down AMETEK, Inc. and American Airlines Group Inc.'s Expenses
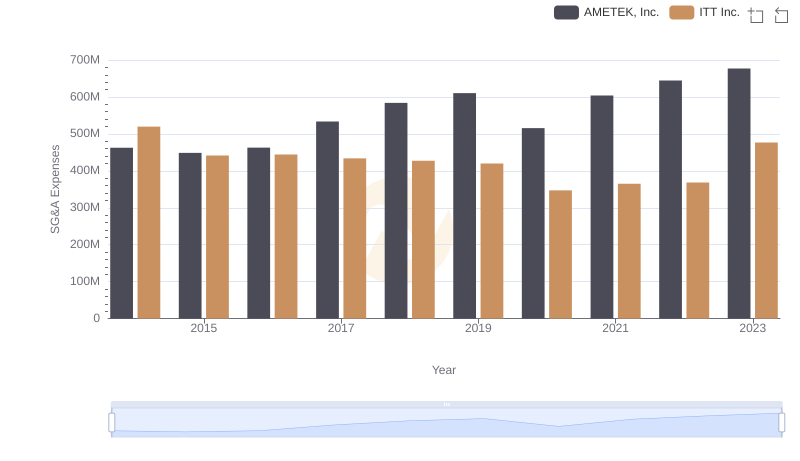
Comparing SG&A Expenses: AMETEK, Inc. vs ITT Inc. Trends and Insights
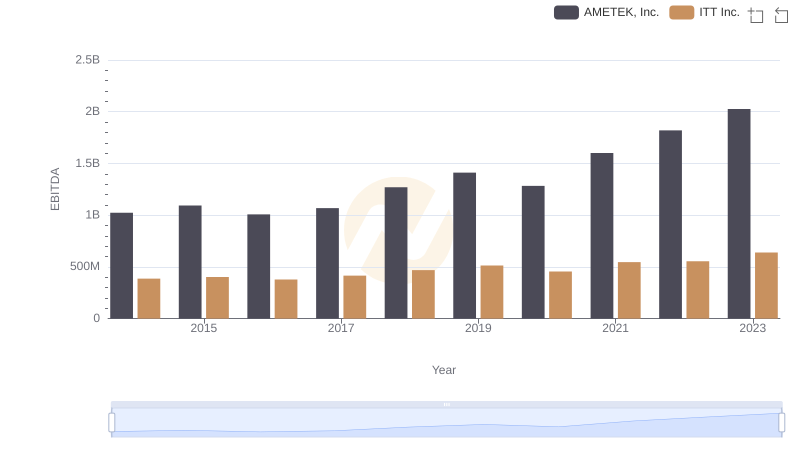
Comprehensive EBITDA Comparison: AMETEK, Inc. vs ITT Inc.