| __timestamp | AMETEK, Inc. | Nordson Corporation |
|---|---|---|
| Wednesday, January 1, 2014 | 462637000 | 577993000 |
| Thursday, January 1, 2015 | 448592000 | 596234000 |
| Friday, January 1, 2016 | 462970000 | 605068000 |
| Sunday, January 1, 2017 | 533645000 | 681299000 |
| Monday, January 1, 2018 | 584022000 | 741408000 |
| Tuesday, January 1, 2019 | 610280000 | 708990000 |
| Wednesday, January 1, 2020 | 515630000 | 693552000 |
| Friday, January 1, 2021 | 603944000 | 708953000 |
| Saturday, January 1, 2022 | 644577000 | 724176000 |
| Sunday, January 1, 2023 | 677006000 | 681244000 |
| Monday, January 1, 2024 | 696905000 | 812128000 |
In pursuit of knowledge
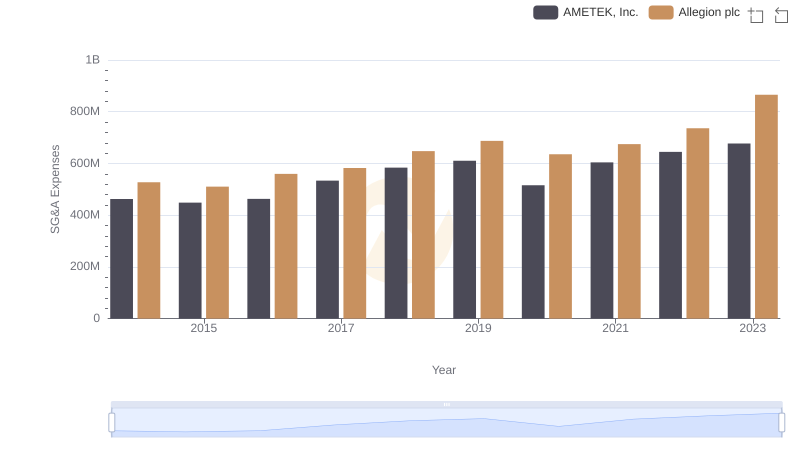
In the competitive landscape of industrial manufacturing, understanding the financial health of companies is crucial. This analysis delves into the Selling, General, and Administrative (SG&A) expenses of AMETEK, Inc. and Nordson Corporation from 2014 to 2023. Over this period, Nordson consistently outpaced AMETEK in SG&A spending, with a notable 40% increase from 2014 to 2023. AMETEK, while showing a steady rise, experienced a 46% growth in the same timeframe. The year 2023 marked a peak for AMETEK, with expenses reaching approximately 677 million, while Nordson's expenses slightly dipped to 681 million. Interestingly, Nordson's 2024 data shows a significant jump, indicating potential strategic investments or expansions. Missing data for AMETEK in 2024 suggests a need for further investigation. These trends highlight the dynamic nature of financial strategies in the industrial sector, offering insights into each company's operational priorities.
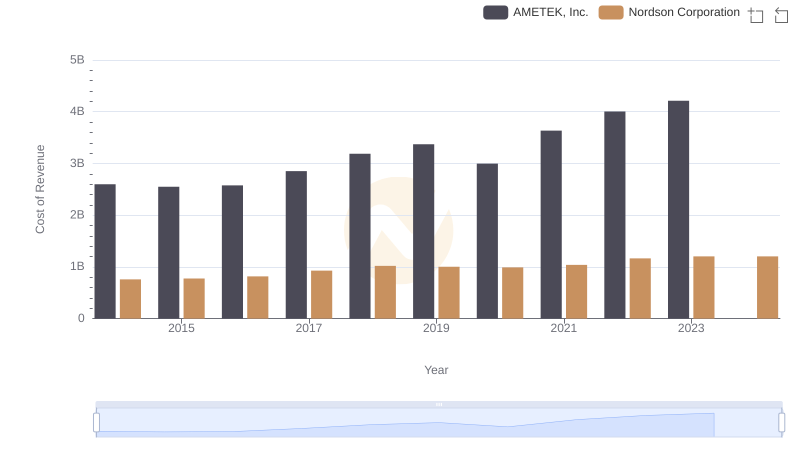
Analyzing Cost of Revenue: AMETEK, Inc. and Nordson Corporation
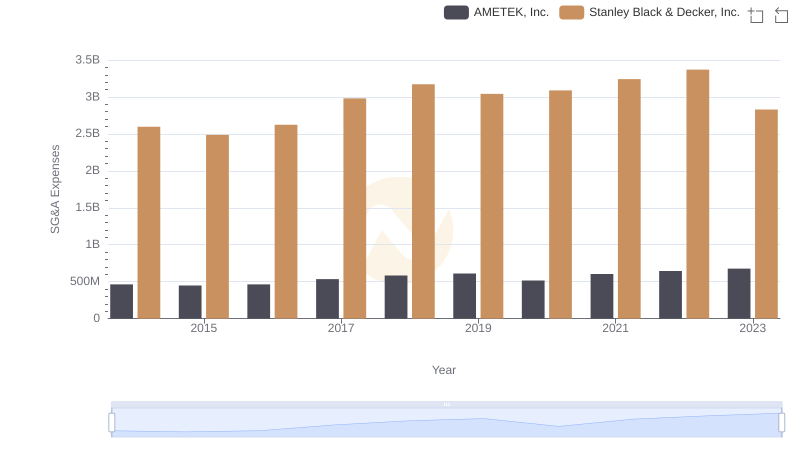
AMETEK, Inc. and Stanley Black & Decker, Inc.: SG&A Spending Patterns Compared
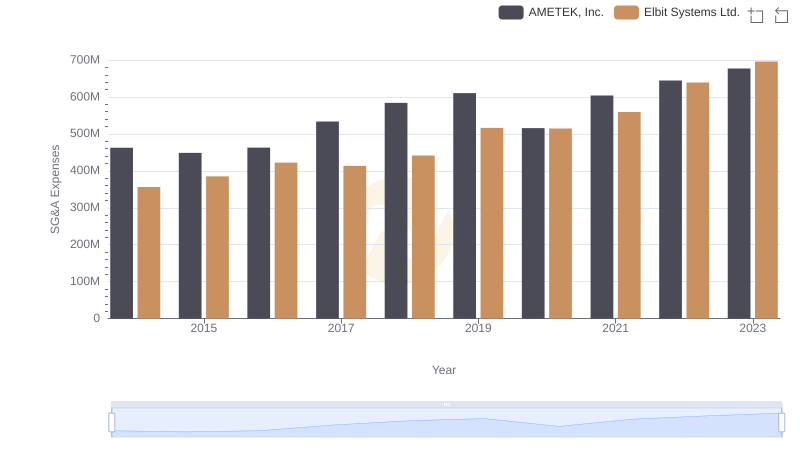
AMETEK, Inc. and Elbit Systems Ltd.: SG&A Spending Patterns Compared
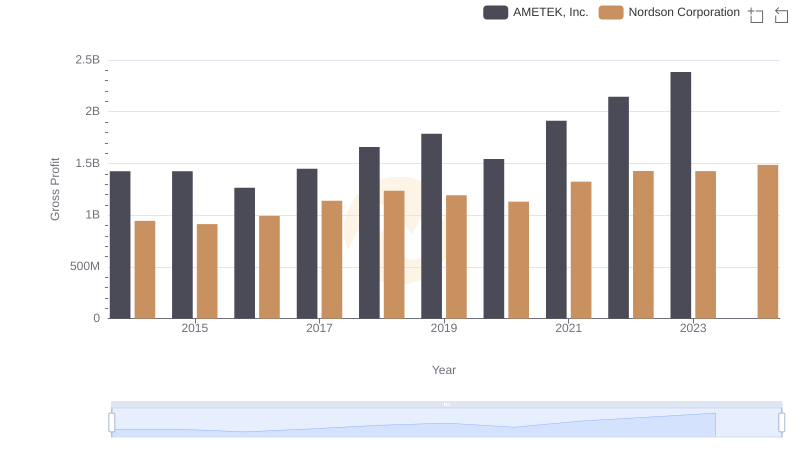
AMETEK, Inc. vs Nordson Corporation: A Gross Profit Performance Breakdown
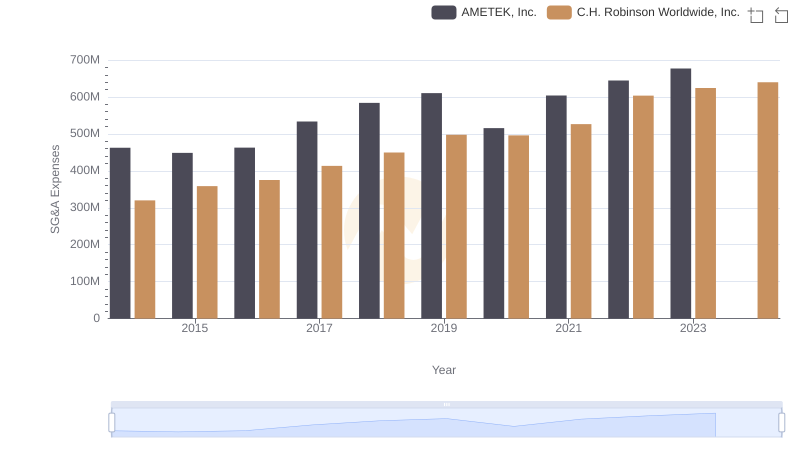
SG&A Efficiency Analysis: Comparing AMETEK, Inc. and C.H. Robinson Worldwide, Inc.
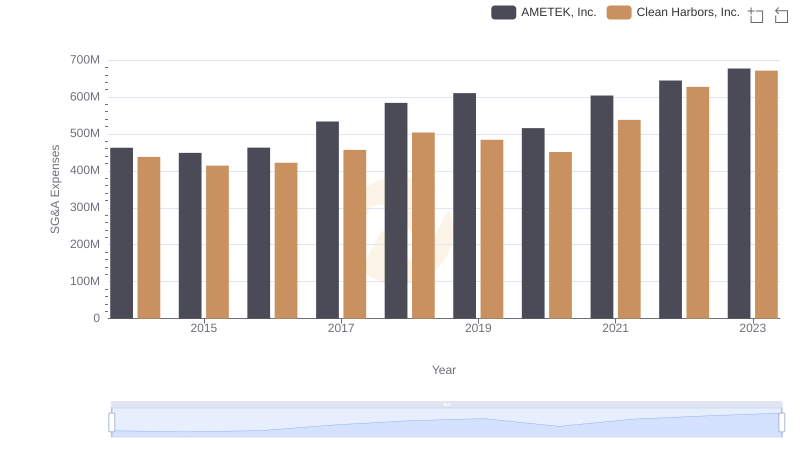
AMETEK, Inc. vs Clean Harbors, Inc.: SG&A Expense Trends
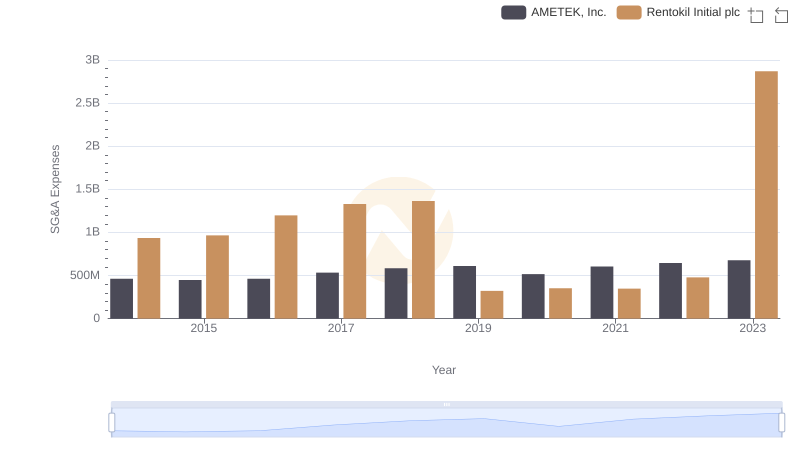
Selling, General, and Administrative Costs: AMETEK, Inc. vs Rentokil Initial plc
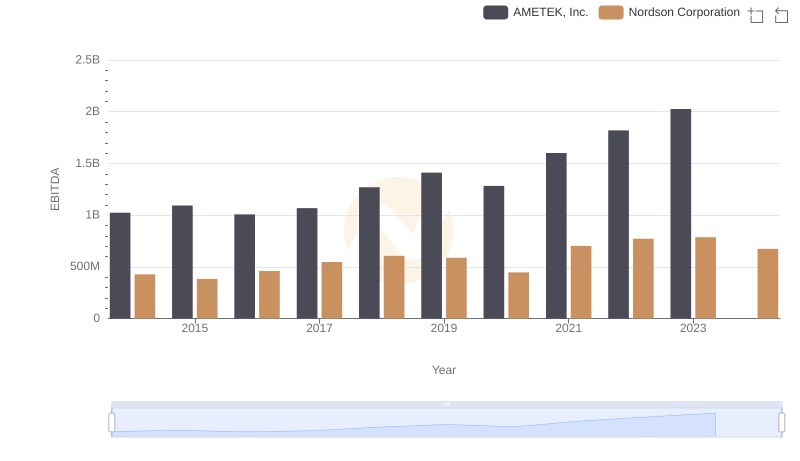
Comparative EBITDA Analysis: AMETEK, Inc. vs Nordson Corporation
Comparing SG&A Expenses: AMETEK, Inc. vs Allegion plc Trends and Insights