| __timestamp | AMETEK, Inc. | Clean Harbors, Inc. |
|---|---|---|
| Wednesday, January 1, 2014 | 462637000 | 437921000 |
| Thursday, January 1, 2015 | 448592000 | 414164000 |
| Friday, January 1, 2016 | 462970000 | 422015000 |
| Sunday, January 1, 2017 | 533645000 | 456648000 |
| Monday, January 1, 2018 | 584022000 | 503747000 |
| Tuesday, January 1, 2019 | 610280000 | 484054000 |
| Wednesday, January 1, 2020 | 515630000 | 451044000 |
| Friday, January 1, 2021 | 603944000 | 537962000 |
| Saturday, January 1, 2022 | 644577000 | 627391000 |
| Sunday, January 1, 2023 | 677006000 | 671161000 |
| Monday, January 1, 2024 | 696905000 | 739629000 |
Cracking the code
In the competitive landscape of industrial manufacturing and environmental services, understanding financial trends is crucial. Over the past decade, AMETEK, Inc. and Clean Harbors, Inc. have shown distinct patterns in their Selling, General, and Administrative (SG&A) expenses. From 2014 to 2023, AMETEK's SG&A expenses grew by approximately 46%, reflecting strategic investments and expansion efforts. In contrast, Clean Harbors saw a 53% increase, indicating a robust growth trajectory in environmental services.
These trends highlight the dynamic nature of operational costs in these industries, offering valuable insights for investors and analysts alike.
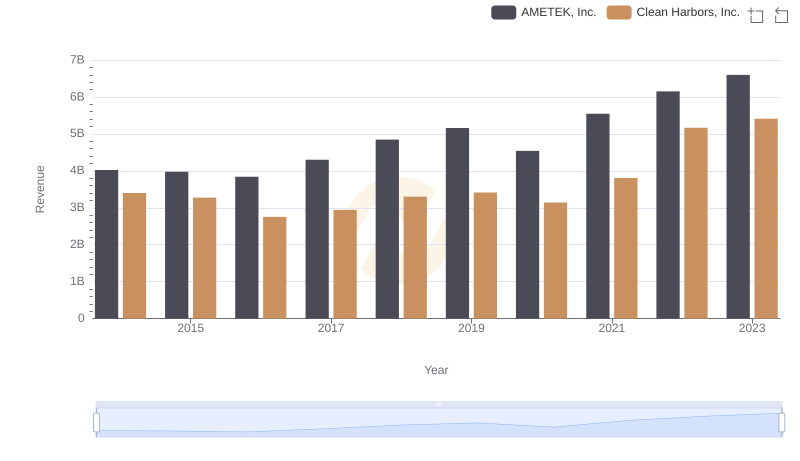
Revenue Showdown: AMETEK, Inc. vs Clean Harbors, Inc.
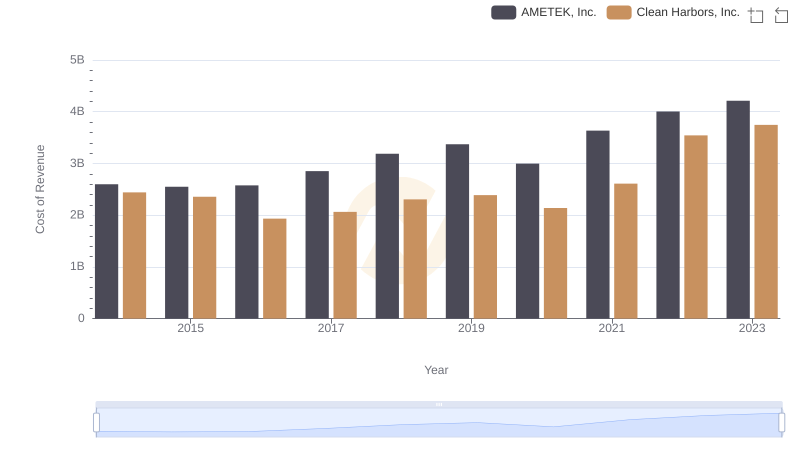
Analyzing Cost of Revenue: AMETEK, Inc. and Clean Harbors, Inc.
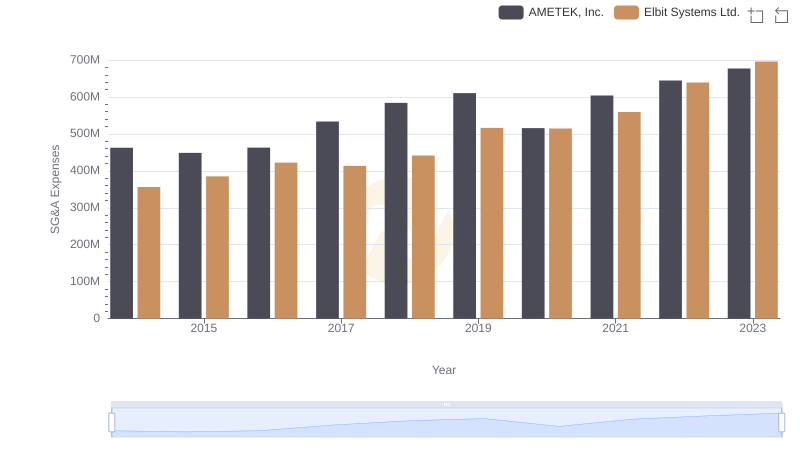
AMETEK, Inc. and Elbit Systems Ltd.: SG&A Spending Patterns Compared
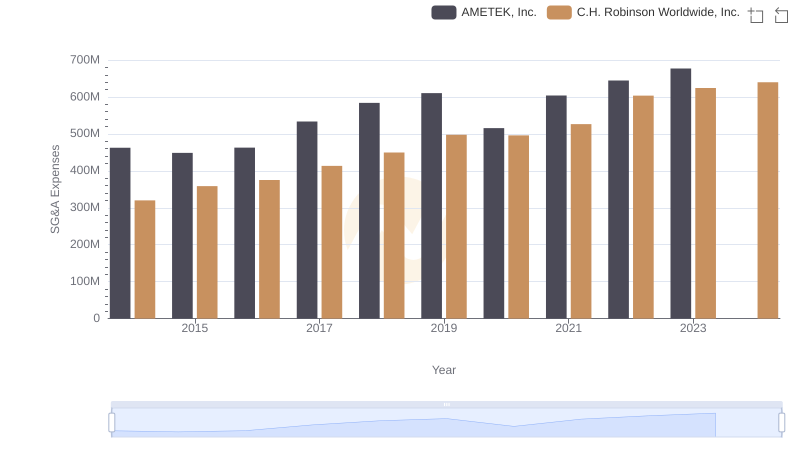
SG&A Efficiency Analysis: Comparing AMETEK, Inc. and C.H. Robinson Worldwide, Inc.
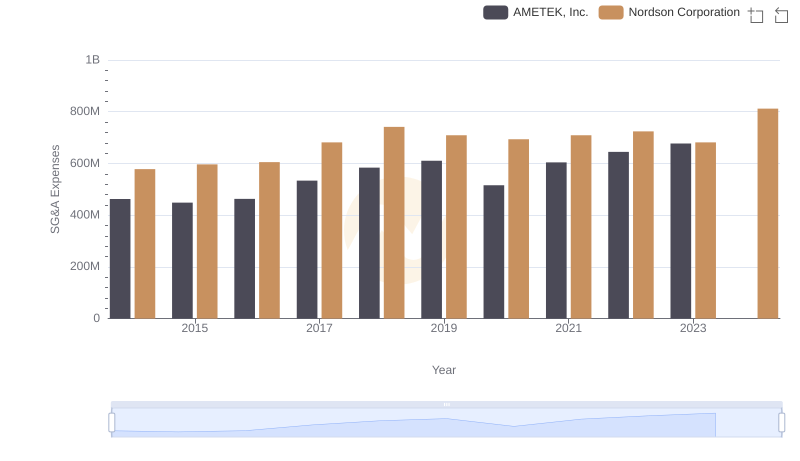
AMETEK, Inc. vs Nordson Corporation: SG&A Expense Trends
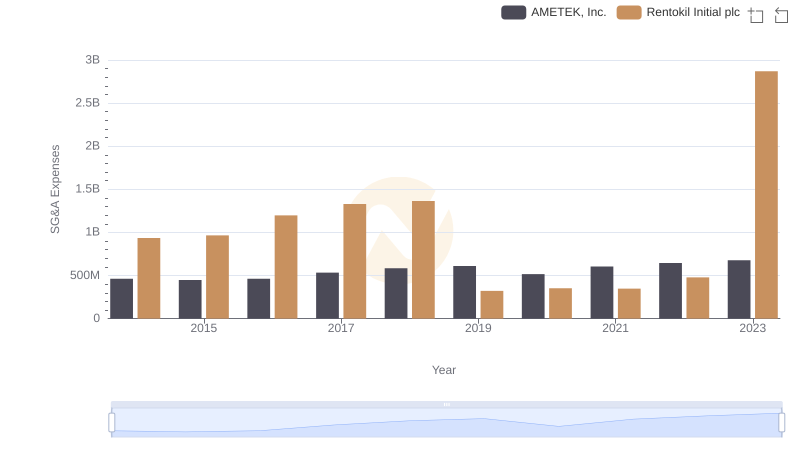
Selling, General, and Administrative Costs: AMETEK, Inc. vs Rentokil Initial plc
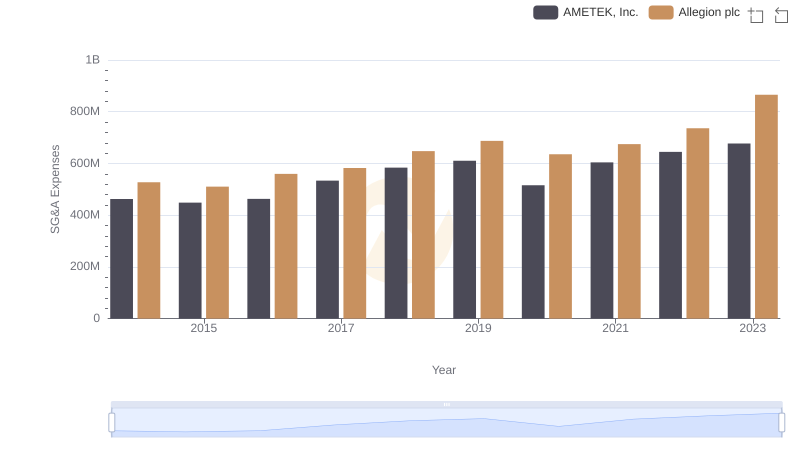
Comparing SG&A Expenses: AMETEK, Inc. vs Allegion plc Trends and Insights
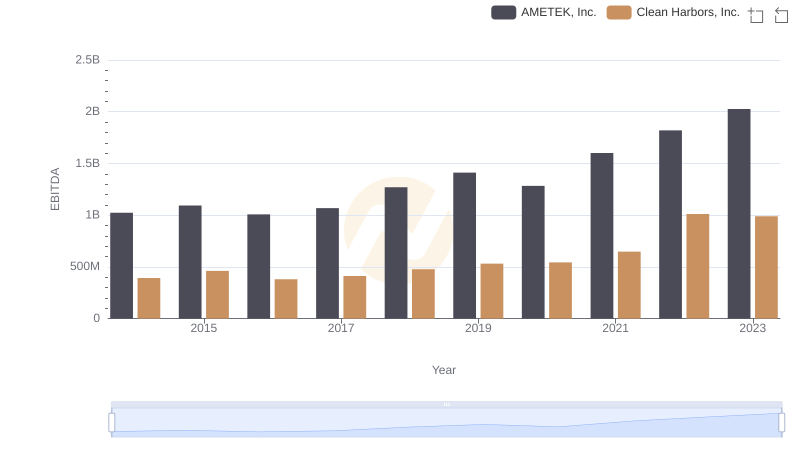
EBITDA Performance Review: AMETEK, Inc. vs Clean Harbors, Inc.
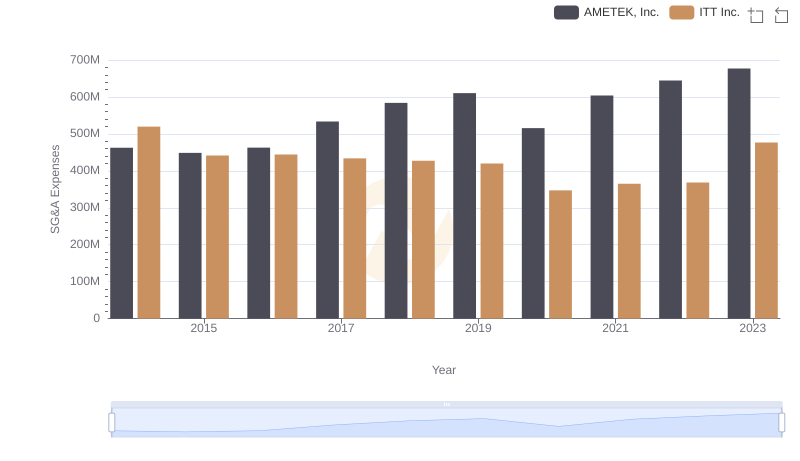
Comparing SG&A Expenses: AMETEK, Inc. vs ITT Inc. Trends and Insights