| __timestamp | AMETEK, Inc. | Allegion plc |
|---|---|---|
| Wednesday, January 1, 2014 | 462637000 | 527400000 |
| Thursday, January 1, 2015 | 448592000 | 510500000 |
| Friday, January 1, 2016 | 462970000 | 559800000 |
| Sunday, January 1, 2017 | 533645000 | 582500000 |
| Monday, January 1, 2018 | 584022000 | 647500000 |
| Tuesday, January 1, 2019 | 610280000 | 687200000 |
| Wednesday, January 1, 2020 | 515630000 | 635700000 |
| Friday, January 1, 2021 | 603944000 | 674700000 |
| Saturday, January 1, 2022 | 644577000 | 736000000 |
| Sunday, January 1, 2023 | 677006000 | 865600000 |
| Monday, January 1, 2024 | 696905000 | 887800000 |
Cracking the code
In the competitive landscape of industrial manufacturing, AMETEK, Inc. and Allegion plc have showcased intriguing trends in their Selling, General, and Administrative (SG&A) expenses over the past decade. From 2014 to 2023, Allegion plc consistently outpaced AMETEK, Inc. in SG&A spending, with a notable 64% increase from 2014 to 2023. In contrast, AMETEK, Inc. saw a 46% rise in the same period.
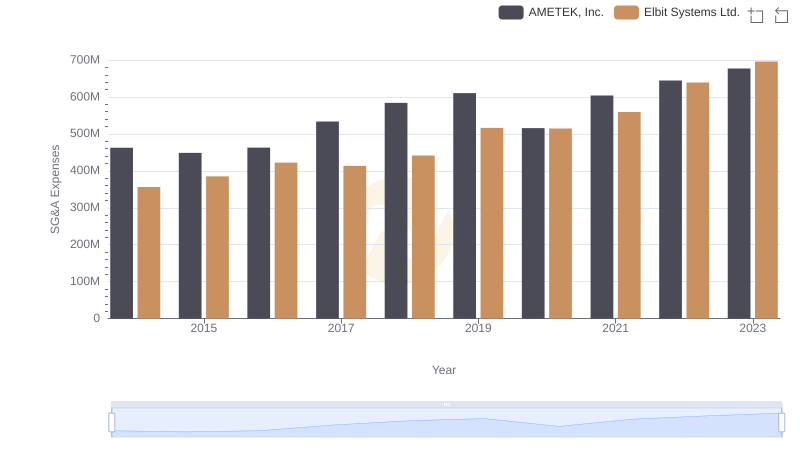
AMETEK, Inc. and Elbit Systems Ltd.: SG&A Spending Patterns Compared
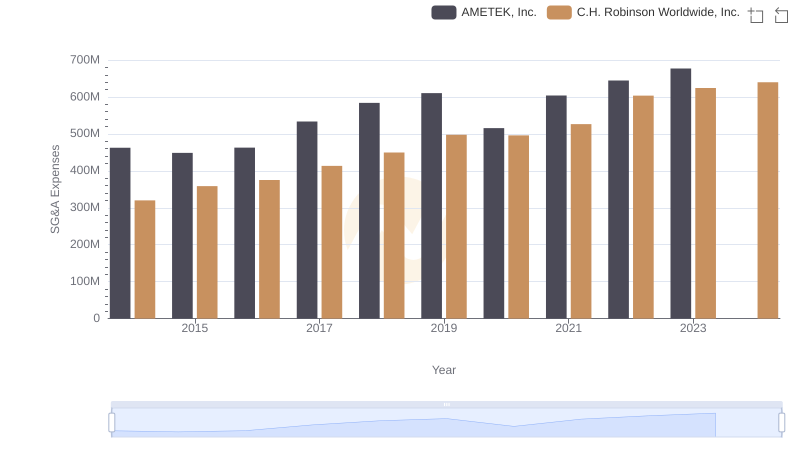
SG&A Efficiency Analysis: Comparing AMETEK, Inc. and C.H. Robinson Worldwide, Inc.
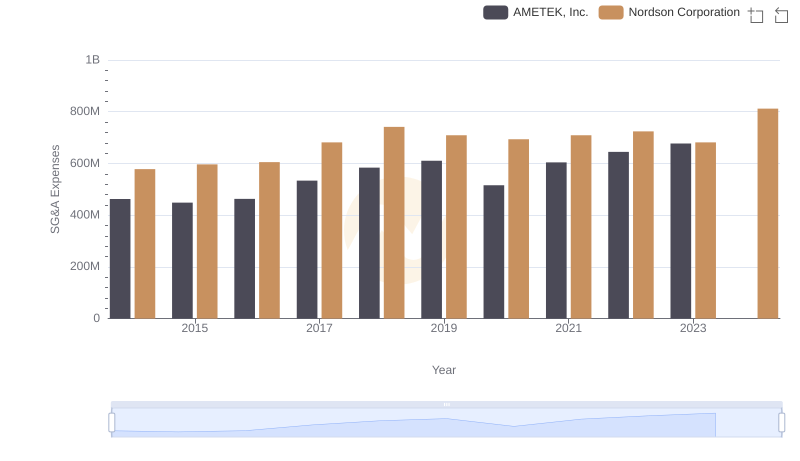
AMETEK, Inc. vs Nordson Corporation: SG&A Expense Trends
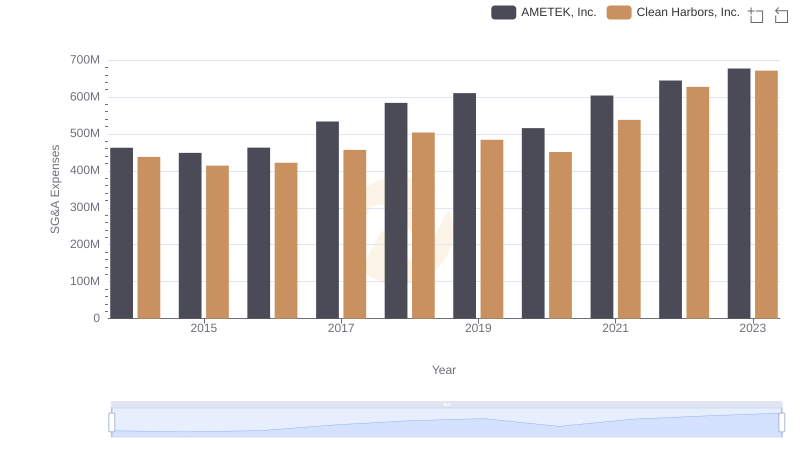
AMETEK, Inc. vs Clean Harbors, Inc.: SG&A Expense Trends
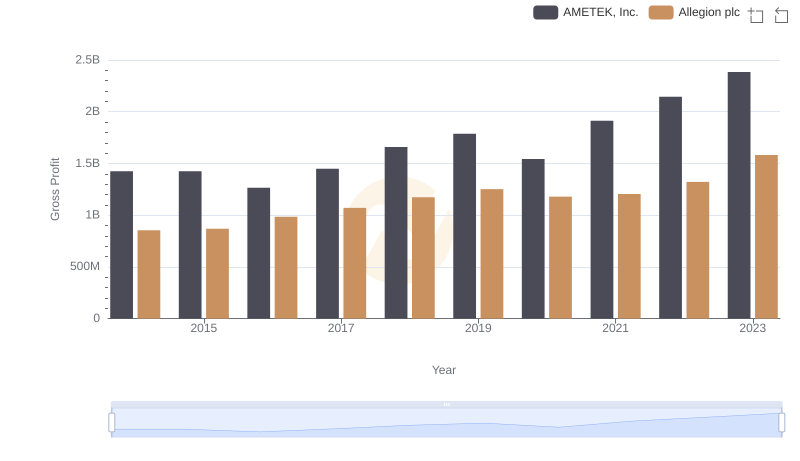
AMETEK, Inc. vs Allegion plc: A Gross Profit Performance Breakdown
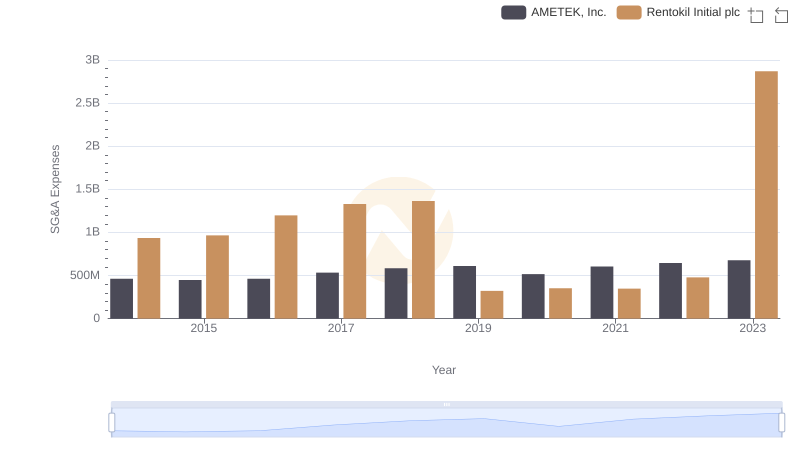
Selling, General, and Administrative Costs: AMETEK, Inc. vs Rentokil Initial plc
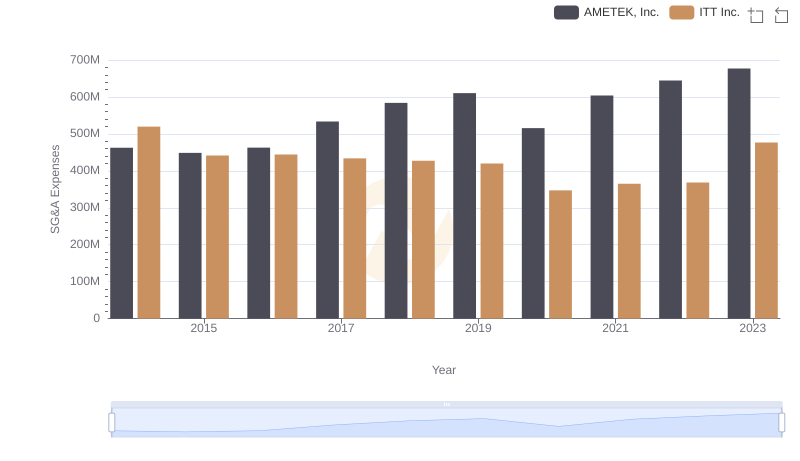
Comparing SG&A Expenses: AMETEK, Inc. vs ITT Inc. Trends and Insights
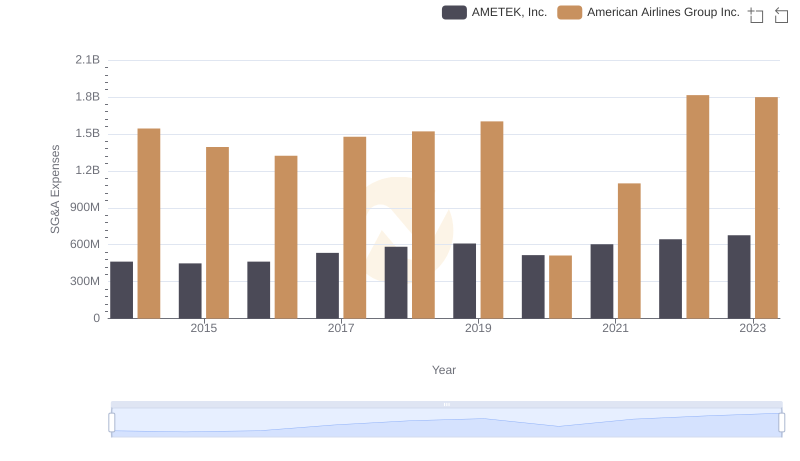
Comparing SG&A Expenses: AMETEK, Inc. vs American Airlines Group Inc. Trends and Insights
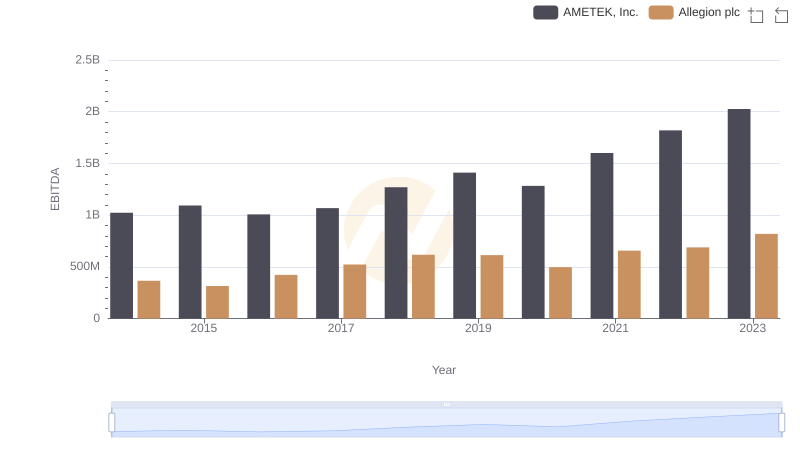
EBITDA Metrics Evaluated: AMETEK, Inc. vs Allegion plc