| __timestamp | HEICO Corporation | Waste Connections, Inc. |
|---|---|---|
| Wednesday, January 1, 2014 | 398312000 | 940778000 |
| Thursday, January 1, 2015 | 434179000 | 939878000 |
| Friday, January 1, 2016 | 515492000 | 1418151000 |
| Sunday, January 1, 2017 | 574725000 | 1925713000 |
| Monday, January 1, 2018 | 690715000 | 2057237000 |
| Tuesday, January 1, 2019 | 813840000 | 2189922000 |
| Wednesday, January 1, 2020 | 682127000 | 2169182000 |
| Friday, January 1, 2021 | 727423000 | 2497287000 |
| Saturday, January 1, 2022 | 862759000 | 2875847000 |
| Sunday, January 1, 2023 | 1153488000 | 3277438000 |
| Monday, January 1, 2024 | 1501726000 | 3727885000 |
Cracking the code
In the competitive landscape of the U.S. stock market, Waste Connections, Inc. and HEICO Corporation have shown remarkable growth in gross profit over the past decade. Since 2014, Waste Connections, Inc. has consistently outperformed HEICO Corporation, with its gross profit growing by approximately 248% by 2023. In contrast, HEICO Corporation has seen a robust increase of around 189% during the same period.
Waste Connections, Inc. experienced a significant surge in 2016, with a 51% increase from the previous year, while HEICO Corporation's growth was more gradual, peaking in 2024. Notably, 2023 marked a record year for both companies, with Waste Connections, Inc. reaching its highest gross profit, despite missing data for 2024. This analysis highlights the dynamic nature of the industry and the strategic maneuvers that have propelled these companies forward.
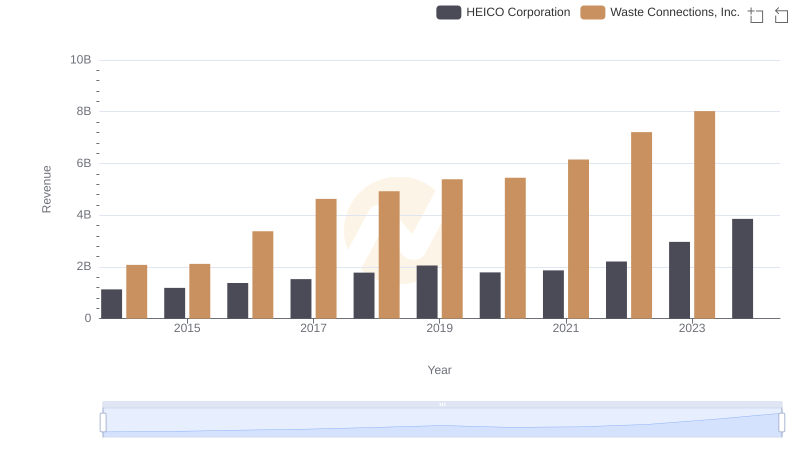
Waste Connections, Inc. vs HEICO Corporation: Examining Key Revenue Metrics
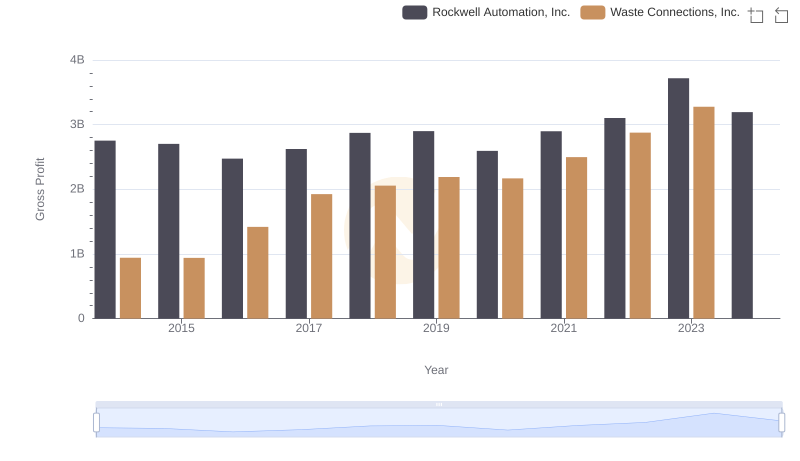
Waste Connections, Inc. and Rockwell Automation, Inc.: A Detailed Gross Profit Analysis
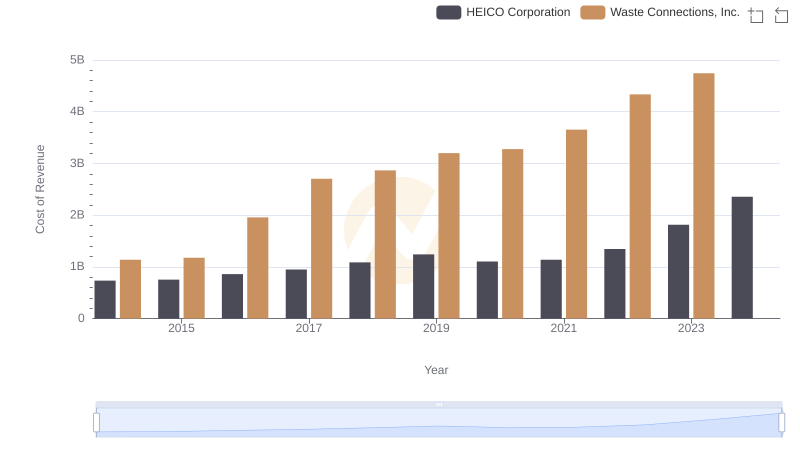
Comparing Cost of Revenue Efficiency: Waste Connections, Inc. vs HEICO Corporation
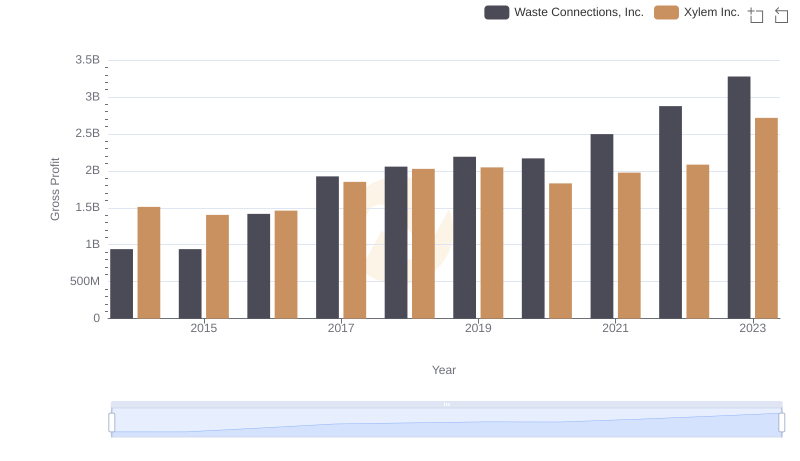
Waste Connections, Inc. vs Xylem Inc.: A Gross Profit Performance Breakdown
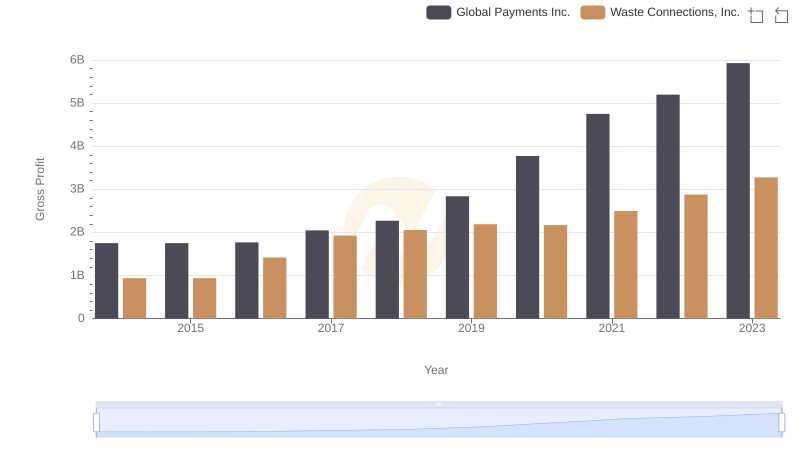
Gross Profit Trends Compared: Waste Connections, Inc. vs Global Payments Inc.
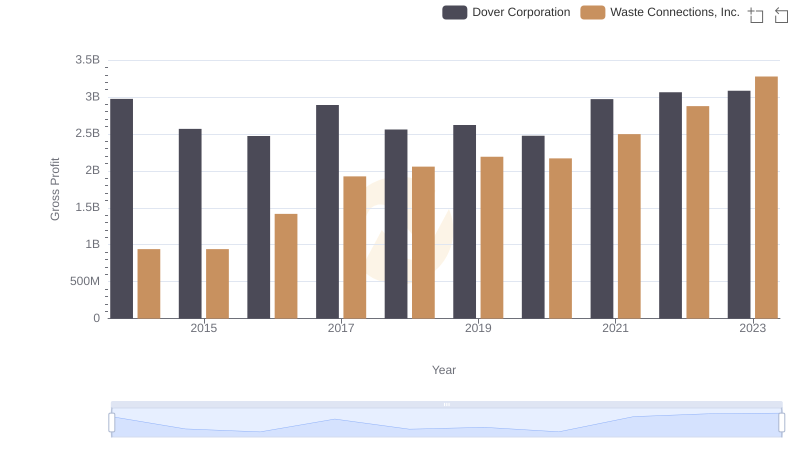
Waste Connections, Inc. and Dover Corporation: A Detailed Gross Profit Analysis
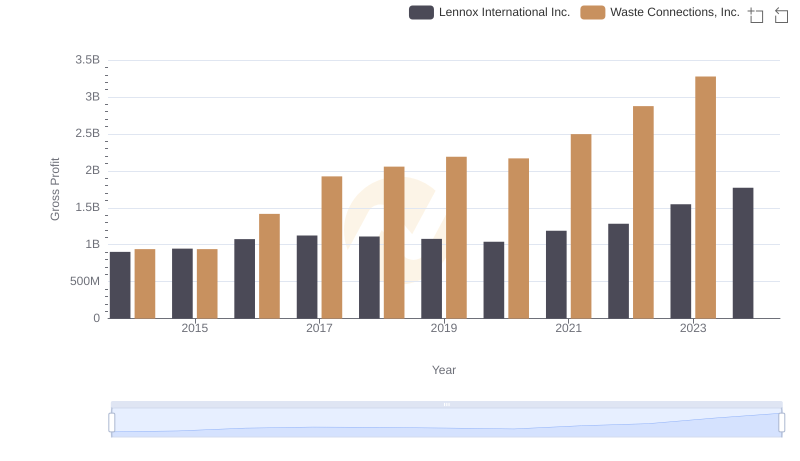
Who Generates Higher Gross Profit? Waste Connections, Inc. or Lennox International Inc.
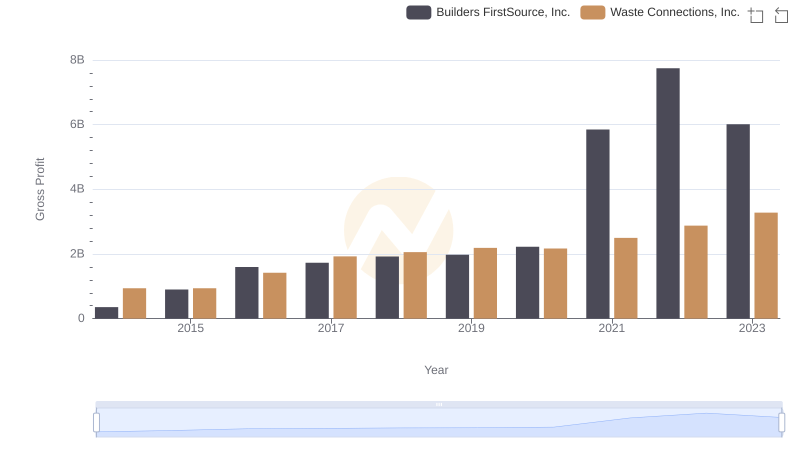
Key Insights on Gross Profit: Waste Connections, Inc. vs Builders FirstSource, Inc.
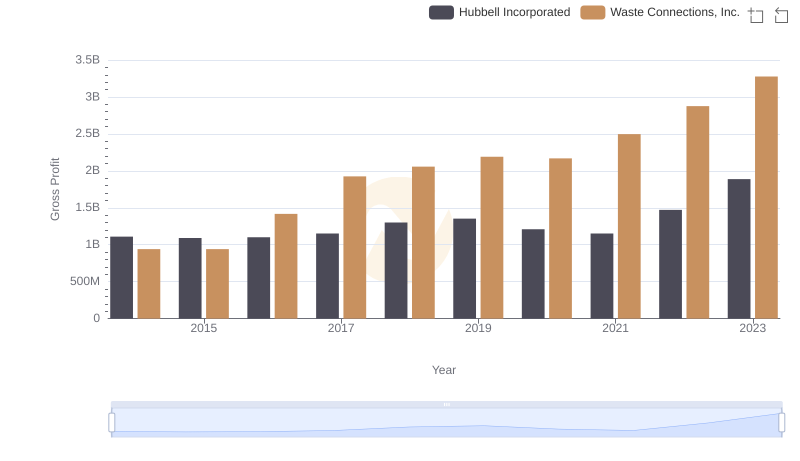
Waste Connections, Inc. and Hubbell Incorporated: A Detailed Gross Profit Analysis
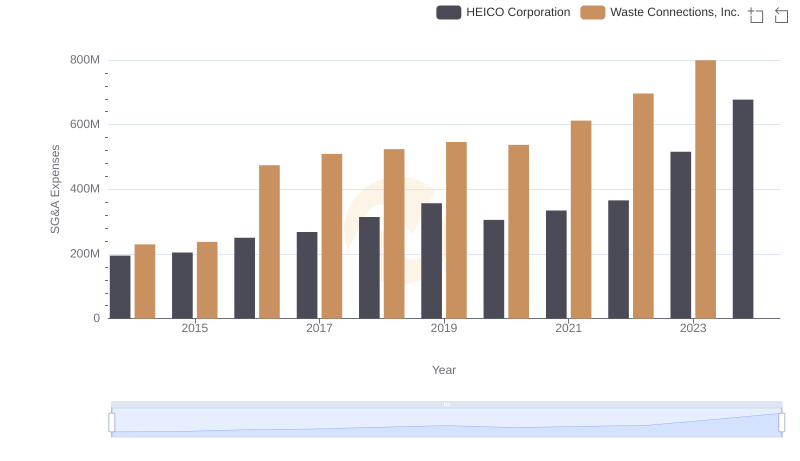
Operational Costs Compared: SG&A Analysis of Waste Connections, Inc. and HEICO Corporation
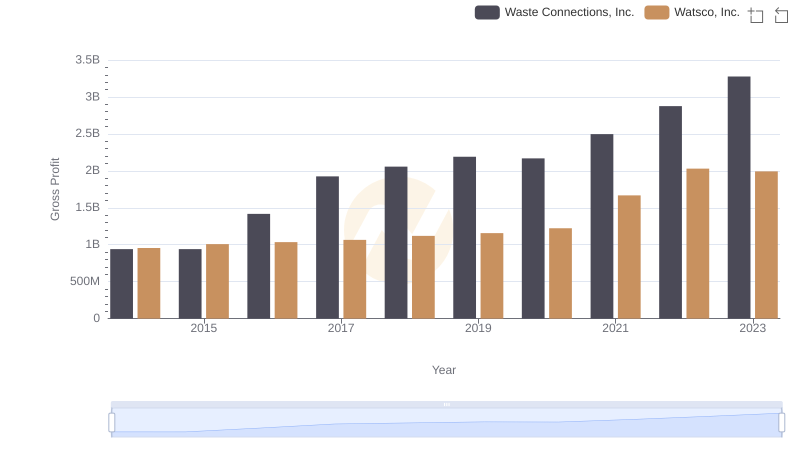
Gross Profit Comparison: Waste Connections, Inc. and Watsco, Inc. Trends
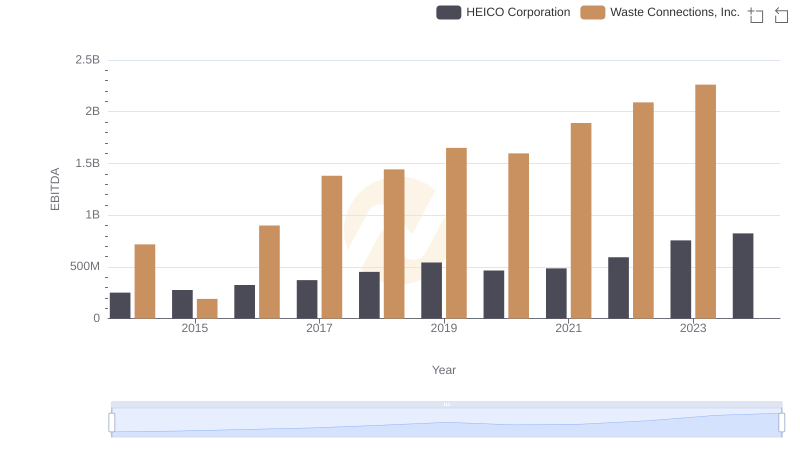
EBITDA Performance Review: Waste Connections, Inc. vs HEICO Corporation