| __timestamp | Waste Connections, Inc. | Xylem Inc. |
|---|---|---|
| Wednesday, January 1, 2014 | 1138388000 | 2403000000 |
| Thursday, January 1, 2015 | 1177409000 | 2249000000 |
| Friday, January 1, 2016 | 1957712000 | 2310000000 |
| Sunday, January 1, 2017 | 2704775000 | 2856000000 |
| Monday, January 1, 2018 | 2865704000 | 3181000000 |
| Tuesday, January 1, 2019 | 3198757000 | 3203000000 |
| Wednesday, January 1, 2020 | 3276808000 | 3046000000 |
| Friday, January 1, 2021 | 3654074000 | 3220000000 |
| Saturday, January 1, 2022 | 4336012000 | 3438000000 |
| Sunday, January 1, 2023 | 4744513000 | 4647000000 |
| Monday, January 1, 2024 | 5191706000 |
Data in motion
In the ever-evolving landscape of industrial services, understanding cost dynamics is crucial. Waste Connections, Inc. and Xylem Inc., two giants in their respective fields, have shown intriguing trends in their cost of revenue over the past decade. From 2014 to 2023, Waste Connections, Inc. saw a remarkable increase of over 300% in its cost of revenue, peaking at approximately $4.7 billion in 2023. This growth reflects the company's expanding operations and market reach. Meanwhile, Xylem Inc. experienced a steady rise, with a 93% increase, reaching around $4.6 billion in the same year. This trend underscores Xylem's strategic investments in water technology solutions. The data highlights the resilience and adaptability of these companies in a competitive market, offering valuable insights for investors and industry analysts alike.
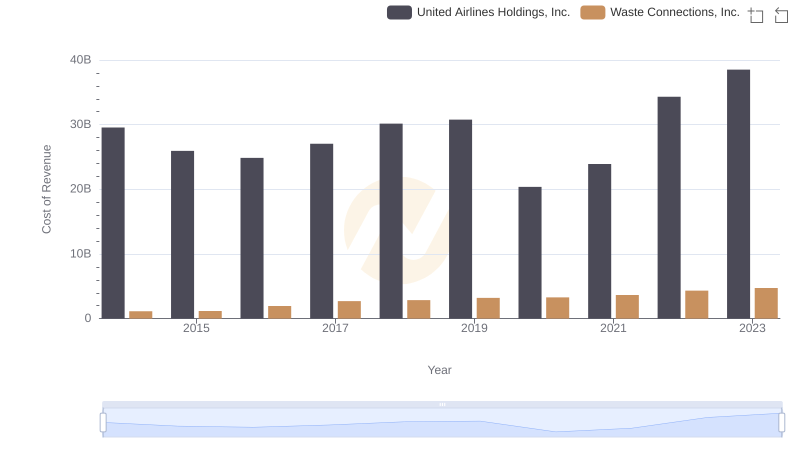
Cost of Revenue Comparison: Waste Connections, Inc. vs United Airlines Holdings, Inc.
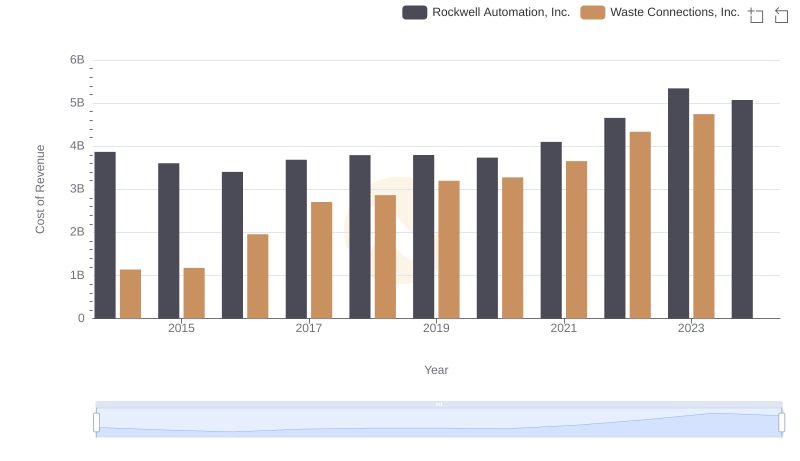
Cost of Revenue: Key Insights for Waste Connections, Inc. and Rockwell Automation, Inc.
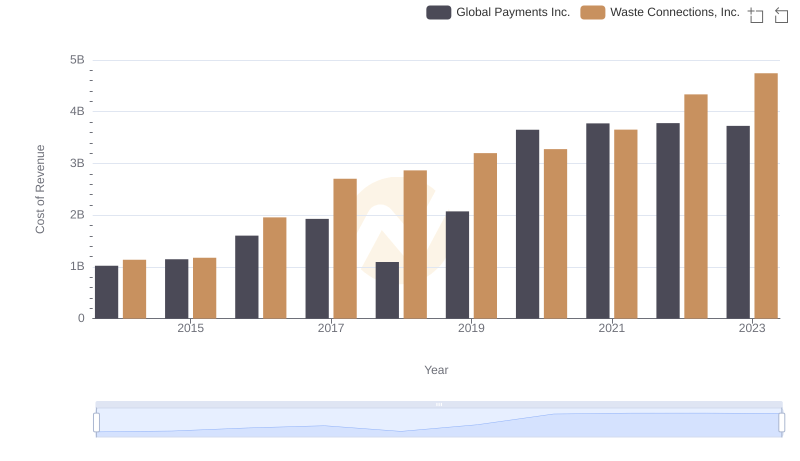
Cost Insights: Breaking Down Waste Connections, Inc. and Global Payments Inc.'s Expenses
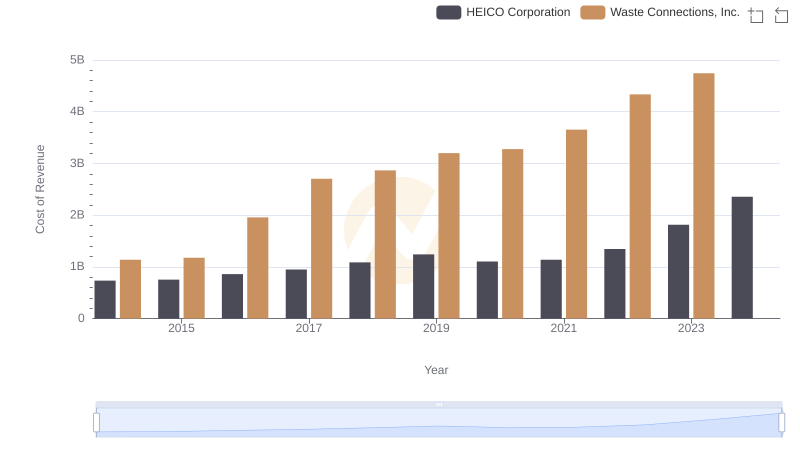
Comparing Cost of Revenue Efficiency: Waste Connections, Inc. vs HEICO Corporation
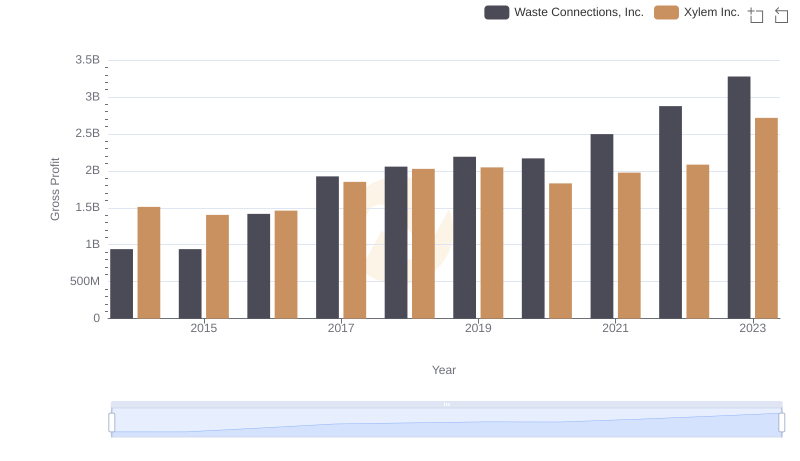
Waste Connections, Inc. vs Xylem Inc.: A Gross Profit Performance Breakdown
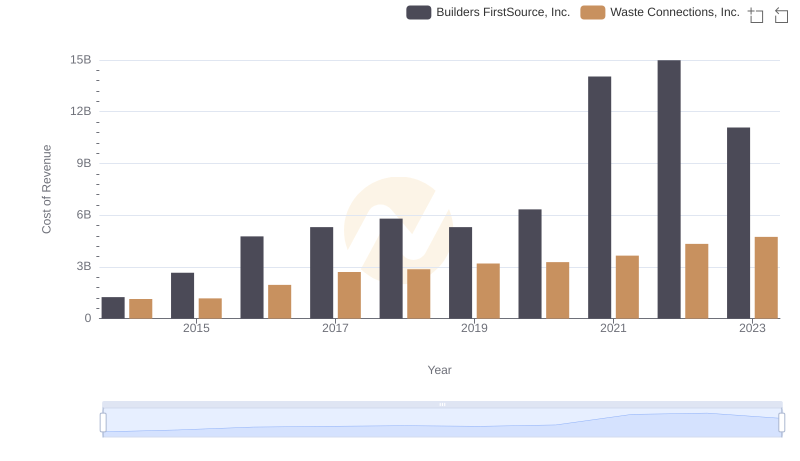
Comparing Cost of Revenue Efficiency: Waste Connections, Inc. vs Builders FirstSource, Inc.
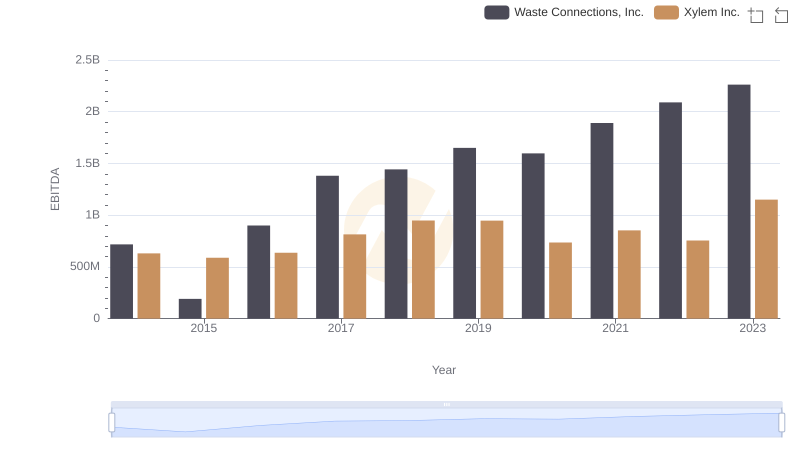
Comprehensive EBITDA Comparison: Waste Connections, Inc. vs Xylem Inc.