| __timestamp | HEICO Corporation | Waste Connections, Inc. |
|---|---|---|
| Wednesday, January 1, 2014 | 251213000 | 717805000 |
| Thursday, January 1, 2015 | 276790000 | 191002871 |
| Friday, January 1, 2016 | 325022000 | 900371894 |
| Sunday, January 1, 2017 | 372581000 | 1380632000 |
| Monday, January 1, 2018 | 452287000 | 1442229014 |
| Tuesday, January 1, 2019 | 542136000 | 1650754605 |
| Wednesday, January 1, 2020 | 465714000 | 1597555000 |
| Friday, January 1, 2021 | 486243000 | 1891001000 |
| Saturday, January 1, 2022 | 592709000 | 2090554149 |
| Sunday, January 1, 2023 | 756767000 | 2261354000 |
| Monday, January 1, 2024 | 824455000 | 2389779000 |
Igniting the spark of knowledge
In the ever-evolving landscape of corporate finance, EBITDA serves as a crucial indicator of a company's operational efficiency. Waste Connections, Inc. and HEICO Corporation, two industry titans, have demonstrated remarkable EBITDA growth over the past decade. From 2014 to 2023, Waste Connections, Inc. saw its EBITDA surge by over 215%, peaking at an impressive $2.26 billion in 2023. Meanwhile, HEICO Corporation experienced a robust 200% increase, reaching $756 million in the same year.
The data reveals a consistent upward trend for both companies, with Waste Connections, Inc. maintaining a higher EBITDA throughout the period. Notably, 2024 data for Waste Connections, Inc. is missing, leaving room for speculation on its future trajectory. This performance review underscores the resilience and strategic prowess of these corporations in navigating economic challenges and capitalizing on growth opportunities.
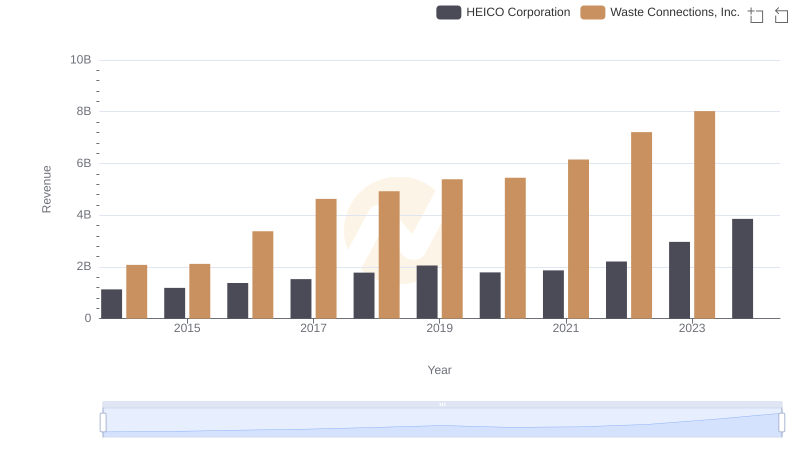
Waste Connections, Inc. vs HEICO Corporation: Examining Key Revenue Metrics
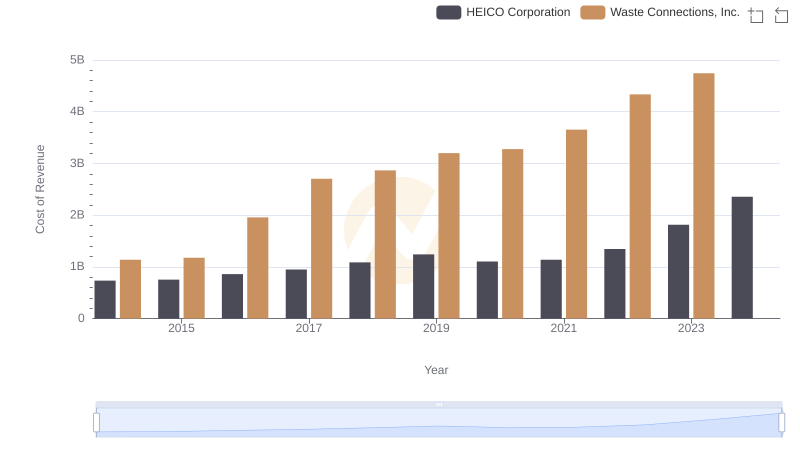
Comparing Cost of Revenue Efficiency: Waste Connections, Inc. vs HEICO Corporation
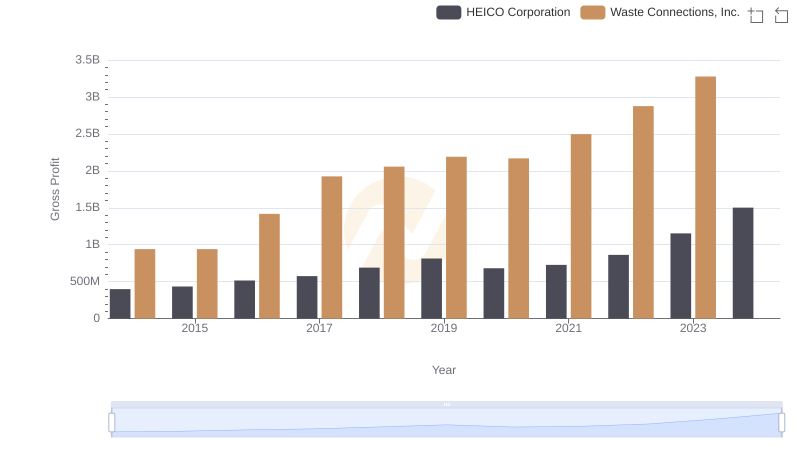
Gross Profit Analysis: Comparing Waste Connections, Inc. and HEICO Corporation
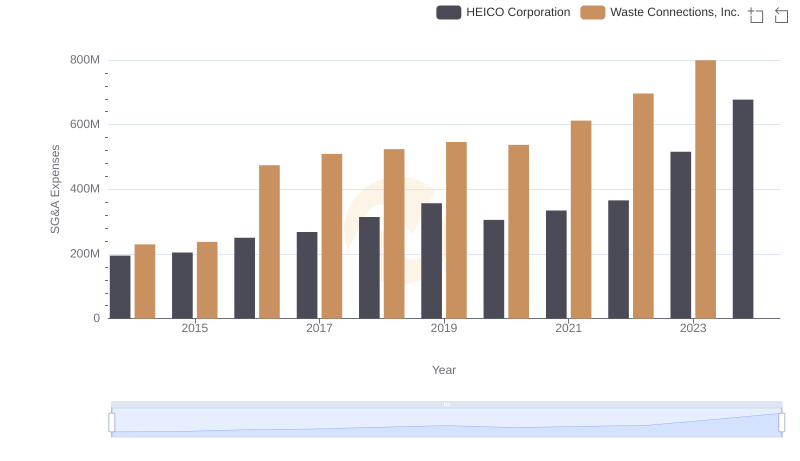
Operational Costs Compared: SG&A Analysis of Waste Connections, Inc. and HEICO Corporation
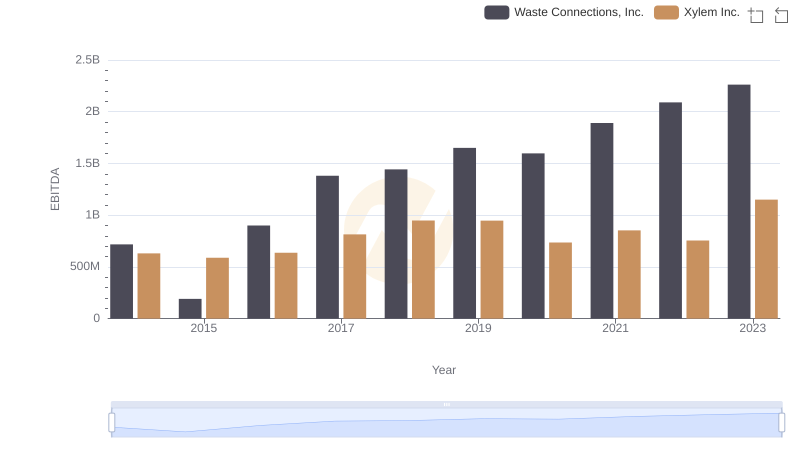
Comprehensive EBITDA Comparison: Waste Connections, Inc. vs Xylem Inc.
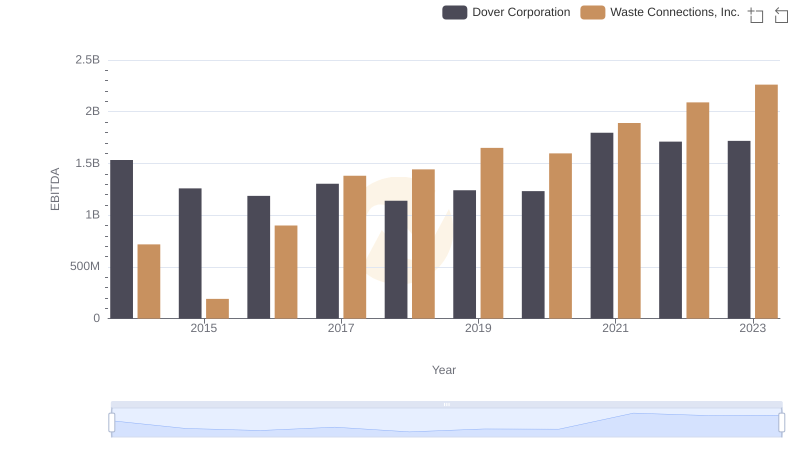
EBITDA Analysis: Evaluating Waste Connections, Inc. Against Dover Corporation
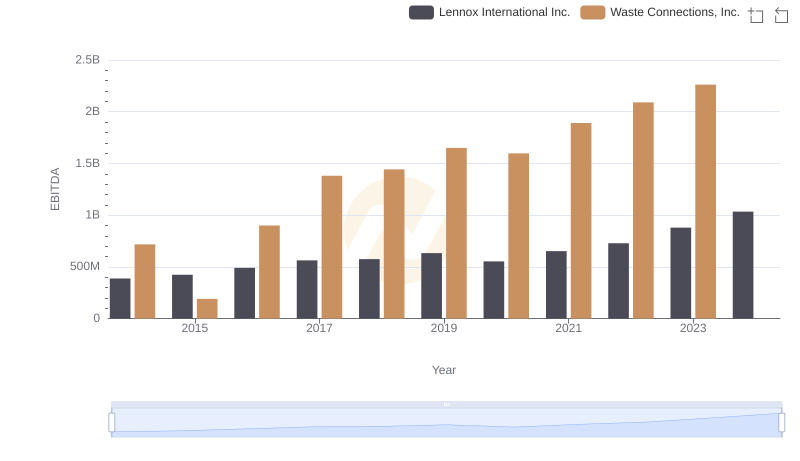
A Side-by-Side Analysis of EBITDA: Waste Connections, Inc. and Lennox International Inc.
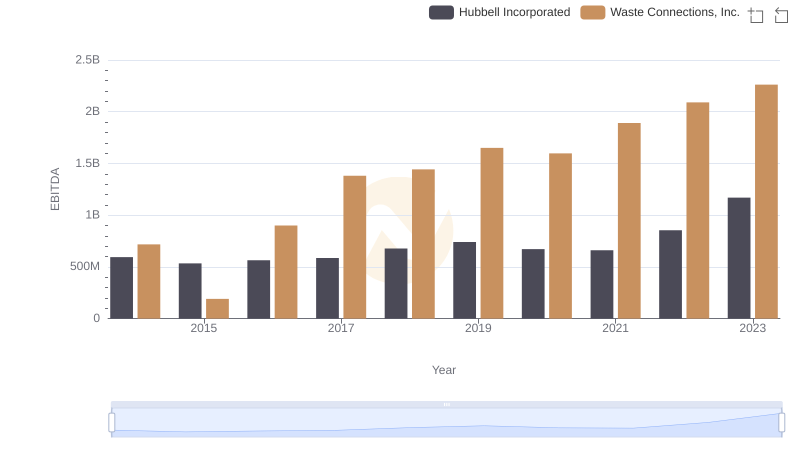
Waste Connections, Inc. vs Hubbell Incorporated: In-Depth EBITDA Performance Comparison
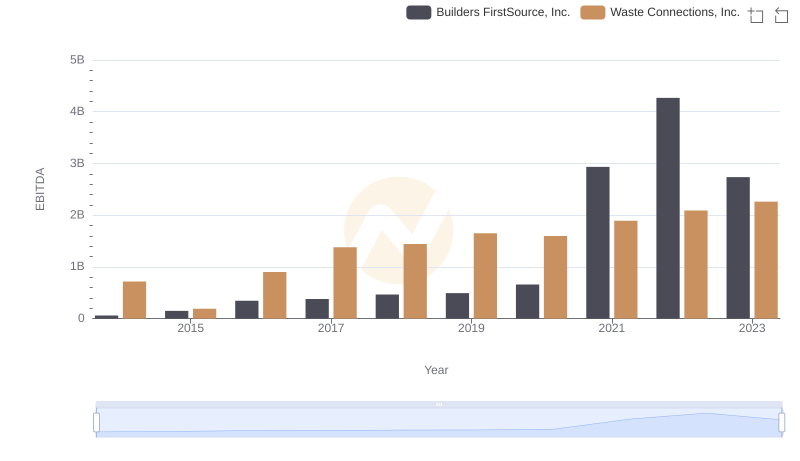
Waste Connections, Inc. vs Builders FirstSource, Inc.: In-Depth EBITDA Performance Comparison
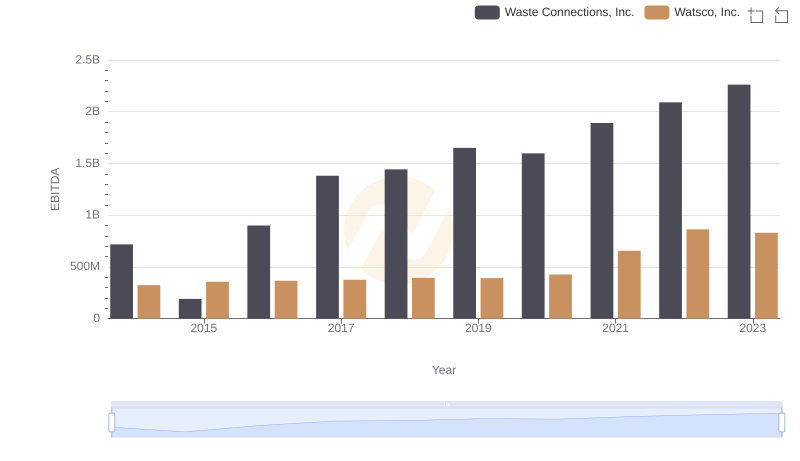
EBITDA Analysis: Evaluating Waste Connections, Inc. Against Watsco, Inc.