| __timestamp | Global Payments Inc. | Waste Connections, Inc. |
|---|---|---|
| Wednesday, January 1, 2014 | 1022107000 | 1138388000 |
| Thursday, January 1, 2015 | 1147639000 | 1177409000 |
| Friday, January 1, 2016 | 1603532000 | 1957712000 |
| Sunday, January 1, 2017 | 1928037000 | 2704775000 |
| Monday, January 1, 2018 | 1095014000 | 2865704000 |
| Tuesday, January 1, 2019 | 2073803000 | 3198757000 |
| Wednesday, January 1, 2020 | 3650727000 | 3276808000 |
| Friday, January 1, 2021 | 3773725000 | 3654074000 |
| Saturday, January 1, 2022 | 3778617000 | 4336012000 |
| Sunday, January 1, 2023 | 3727521000 | 4744513000 |
| Monday, January 1, 2024 | 3760116000 | 5191706000 |
Unlocking the unknown
In the ever-evolving landscape of corporate finance, understanding cost structures is pivotal. Waste Connections, Inc. and Global Payments Inc. have demonstrated intriguing trends in their cost of revenue from 2014 to 2023. Over this period, Waste Connections, Inc. saw a remarkable 316% increase in costs, peaking in 2023. Meanwhile, Global Payments Inc. experienced a 265% rise, with a notable surge in 2020, reaching its zenith in 2022.
The data reveals that Waste Connections, Inc. consistently outpaced Global Payments Inc. in cost growth, particularly from 2016 onwards. This trend underscores the dynamic nature of operational expenses in different sectors. As businesses navigate the complexities of the modern economy, these insights offer a window into strategic financial management and the challenges of maintaining profitability amidst rising costs.
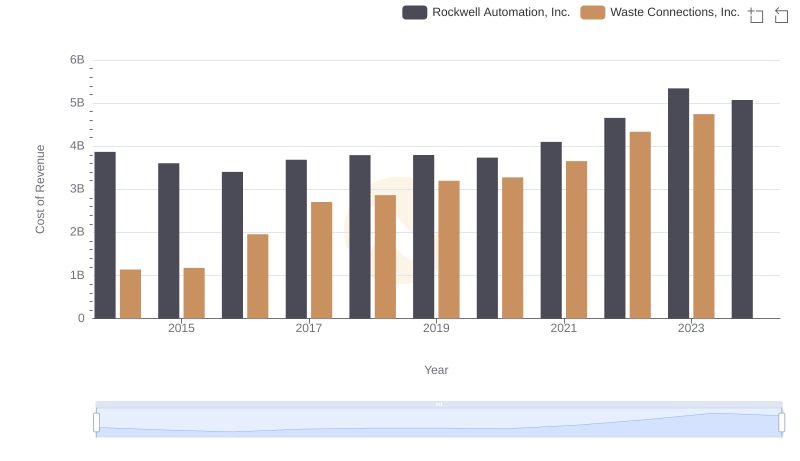
Cost of Revenue: Key Insights for Waste Connections, Inc. and Rockwell Automation, Inc.
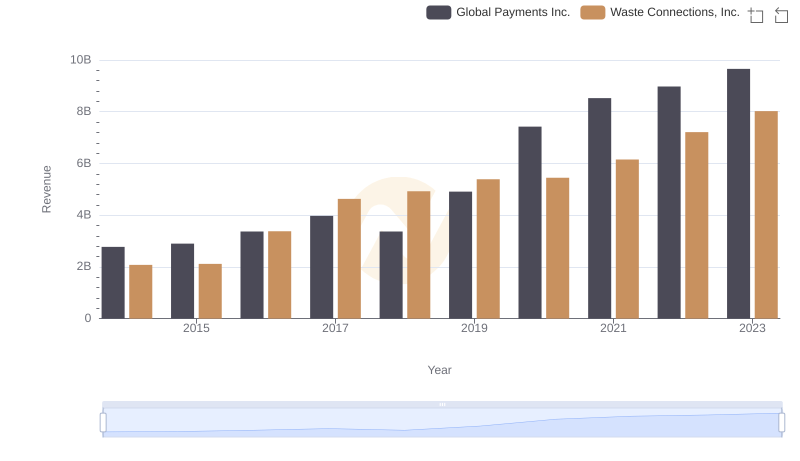
Breaking Down Revenue Trends: Waste Connections, Inc. vs Global Payments Inc.
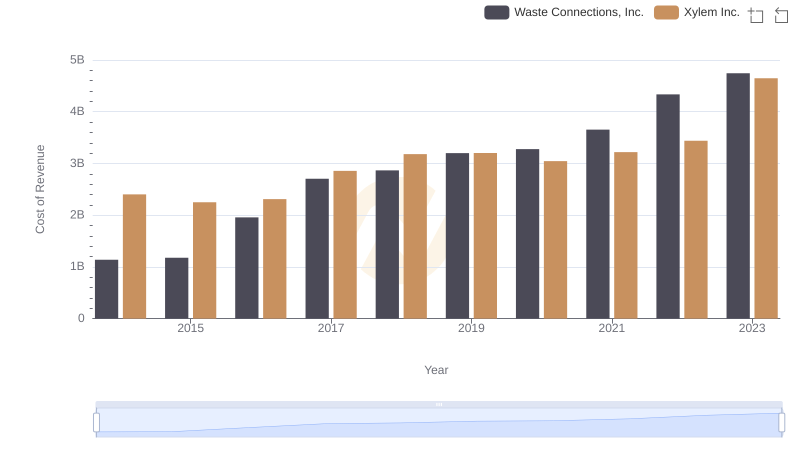
Cost of Revenue: Key Insights for Waste Connections, Inc. and Xylem Inc.
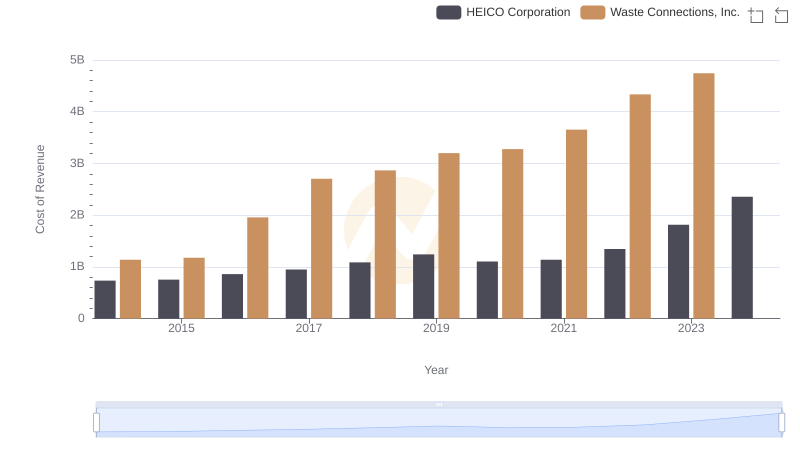
Comparing Cost of Revenue Efficiency: Waste Connections, Inc. vs HEICO Corporation
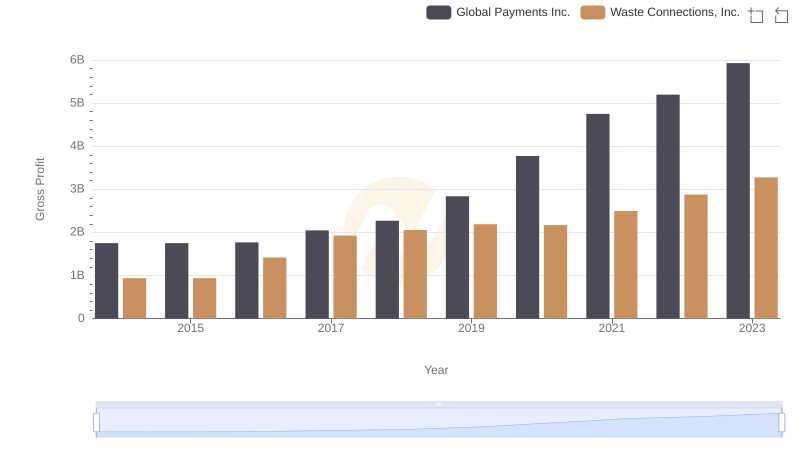
Gross Profit Trends Compared: Waste Connections, Inc. vs Global Payments Inc.
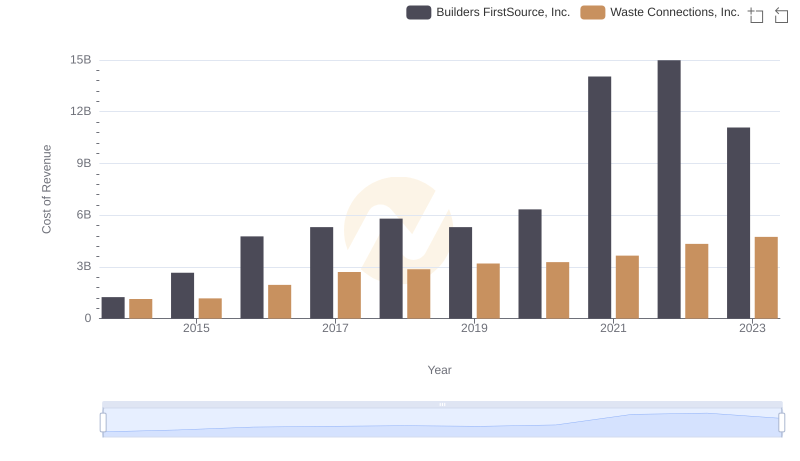
Comparing Cost of Revenue Efficiency: Waste Connections, Inc. vs Builders FirstSource, Inc.
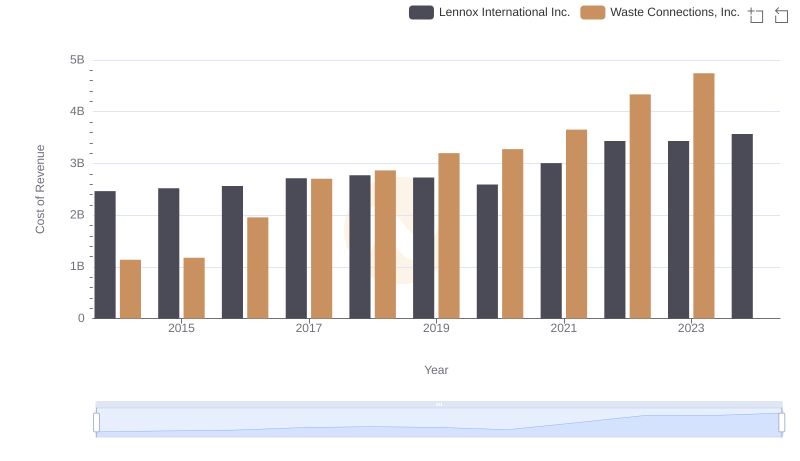
Waste Connections, Inc. vs Lennox International Inc.: Efficiency in Cost of Revenue Explored

Cost of Revenue: Key Insights for Waste Connections, Inc. and Ryanair Holdings plc
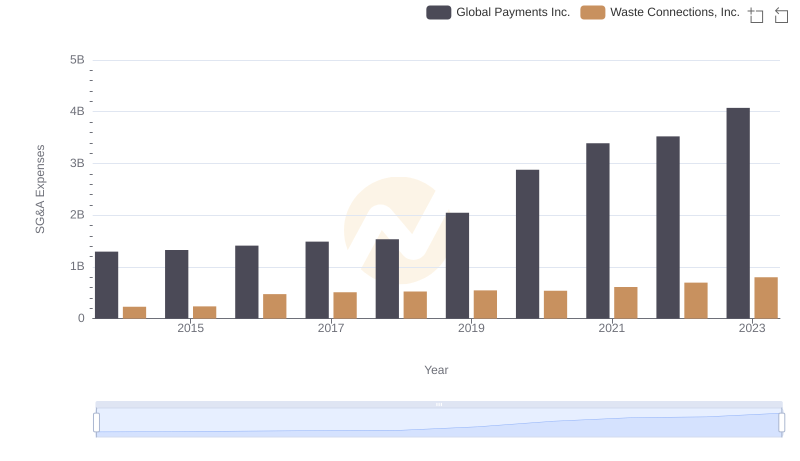
Waste Connections, Inc. and Global Payments Inc.: SG&A Spending Patterns Compared