| __timestamp | HEICO Corporation | Waste Connections, Inc. |
|---|---|---|
| Wednesday, January 1, 2014 | 1132311000 | 2079166000 |
| Thursday, January 1, 2015 | 1188648000 | 2117287000 |
| Friday, January 1, 2016 | 1376258000 | 3375863000 |
| Sunday, January 1, 2017 | 1524813000 | 4630488000 |
| Monday, January 1, 2018 | 1777721000 | 4922941000 |
| Tuesday, January 1, 2019 | 2055647000 | 5388679000 |
| Wednesday, January 1, 2020 | 1787009000 | 5445990000 |
| Friday, January 1, 2021 | 1865682000 | 6151361000 |
| Saturday, January 1, 2022 | 2208322000 | 7211859000 |
| Sunday, January 1, 2023 | 2968105000 | 8021951000 |
| Monday, January 1, 2024 | 3857669000 | 8919591000 |
Unleashing the power of data
In the ever-evolving landscape of American industry, Waste Connections, Inc. and HEICO Corporation stand as titans in their respective fields. Over the past decade, these companies have demonstrated remarkable growth, with Waste Connections, Inc. leading the charge. From 2014 to 2023, Waste Connections, Inc. saw its revenue soar by nearly 286%, reaching a peak in 2023. Meanwhile, HEICO Corporation, a leader in aerospace and electronics, experienced a robust 170% increase in revenue over the same period.
The data reveals a compelling narrative of growth and resilience. Waste Connections, Inc. consistently outpaced HEICO Corporation, with revenues nearly doubling those of HEICO by 2023. However, the absence of data for Waste Connections, Inc. in 2024 leaves room for speculation. As these companies continue to innovate, their trajectories offer valuable insights into the dynamics of their industries.
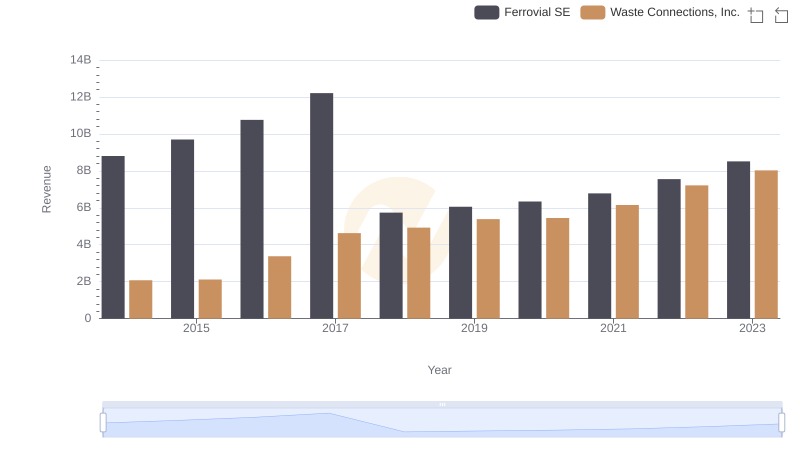
Revenue Showdown: Waste Connections, Inc. vs Ferrovial SE
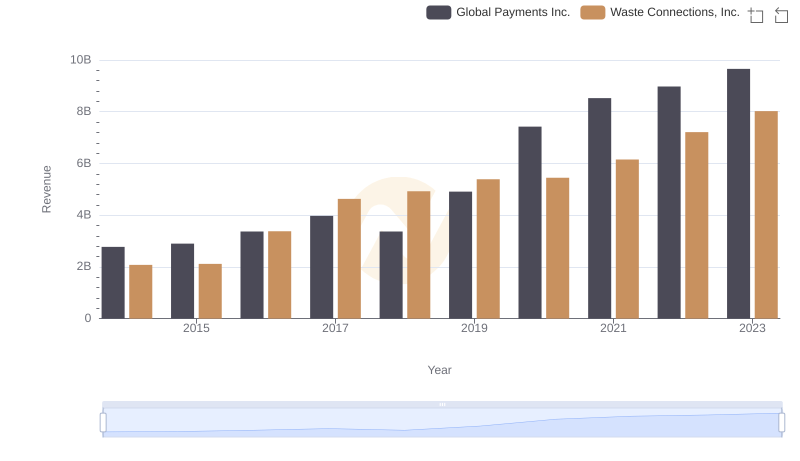
Breaking Down Revenue Trends: Waste Connections, Inc. vs Global Payments Inc.
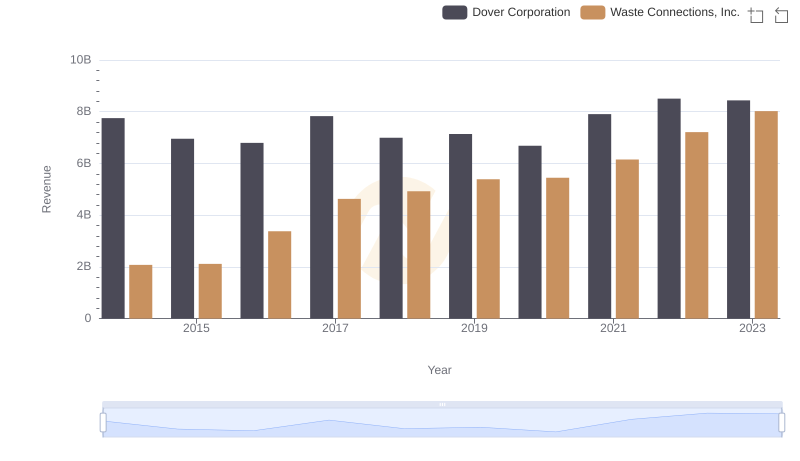
Revenue Showdown: Waste Connections, Inc. vs Dover Corporation
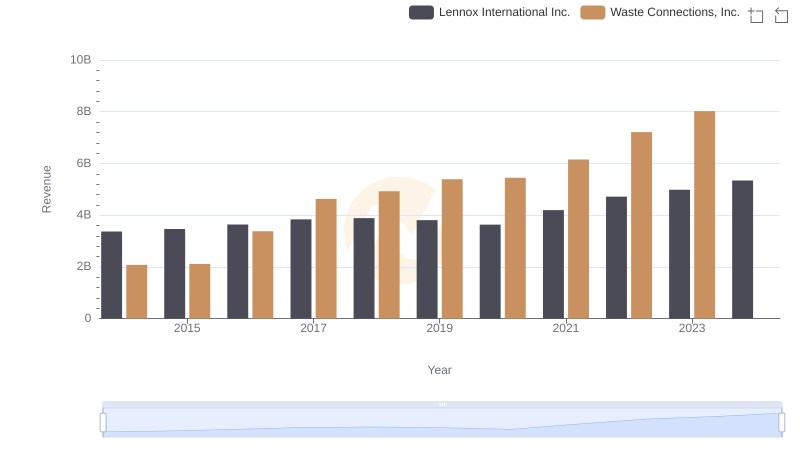
Revenue Insights: Waste Connections, Inc. and Lennox International Inc. Performance Compared
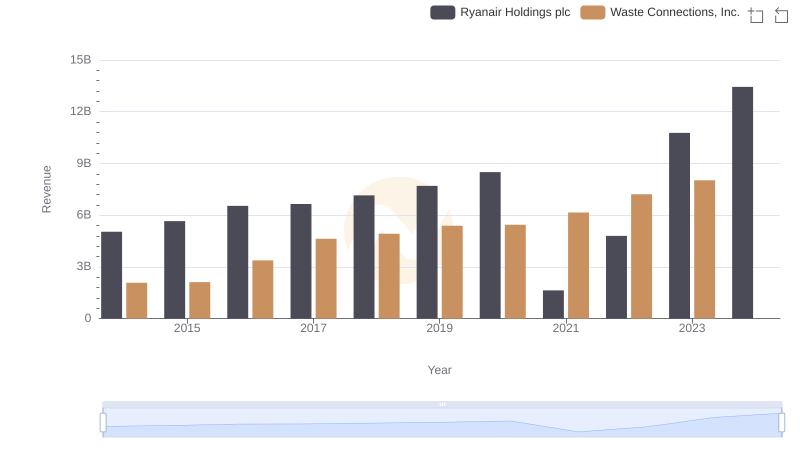
Waste Connections, Inc. vs Ryanair Holdings plc: Examining Key Revenue Metrics
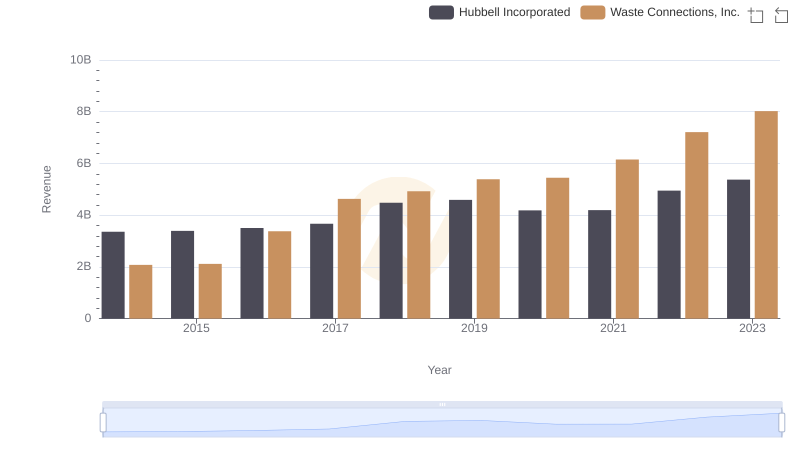
Annual Revenue Comparison: Waste Connections, Inc. vs Hubbell Incorporated
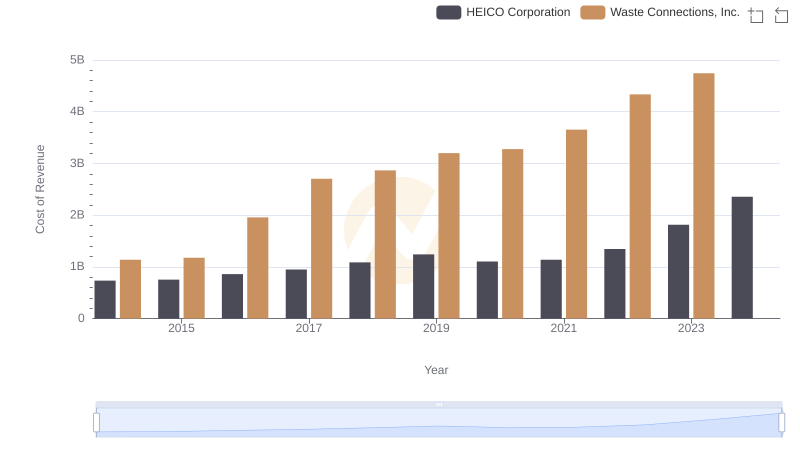
Comparing Cost of Revenue Efficiency: Waste Connections, Inc. vs HEICO Corporation
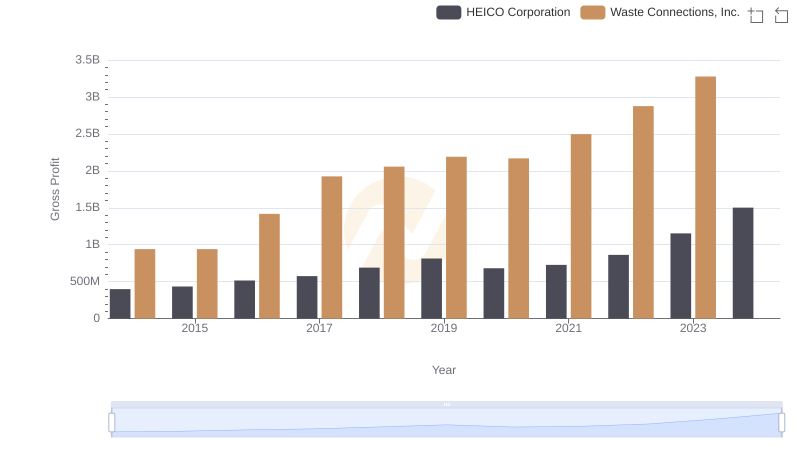
Gross Profit Analysis: Comparing Waste Connections, Inc. and HEICO Corporation
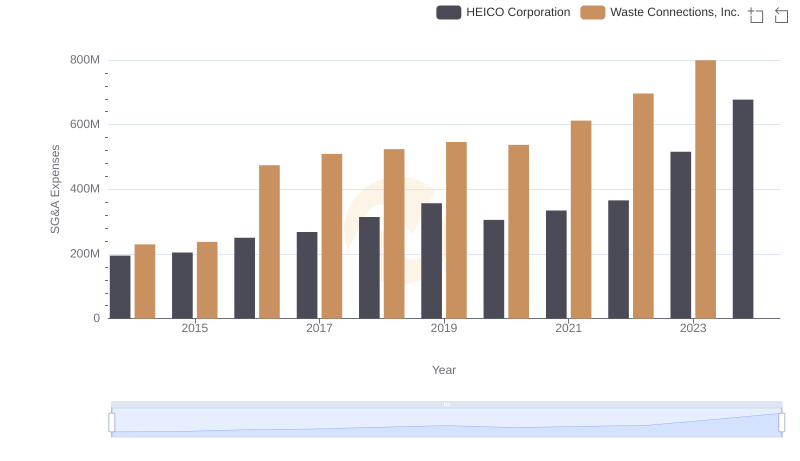
Operational Costs Compared: SG&A Analysis of Waste Connections, Inc. and HEICO Corporation
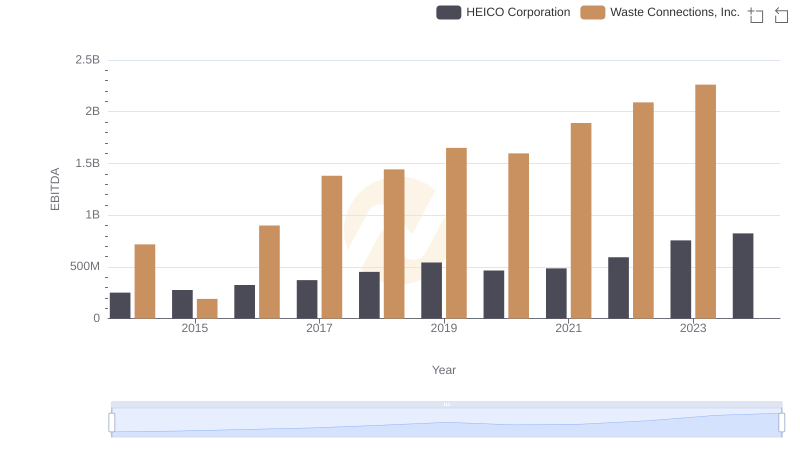
EBITDA Performance Review: Waste Connections, Inc. vs HEICO Corporation