| __timestamp | HEICO Corporation | Trane Technologies plc |
|---|---|---|
| Wednesday, January 1, 2014 | 733999000 | 8982800000 |
| Thursday, January 1, 2015 | 754469000 | 9301600000 |
| Friday, January 1, 2016 | 860766000 | 9329300000 |
| Sunday, January 1, 2017 | 950088000 | 9811600000 |
| Monday, January 1, 2018 | 1087006000 | 10847600000 |
| Tuesday, January 1, 2019 | 1241807000 | 11451500000 |
| Wednesday, January 1, 2020 | 1104882000 | 8651300000 |
| Friday, January 1, 2021 | 1138259000 | 9666800000 |
| Saturday, January 1, 2022 | 1345563000 | 11026900000 |
| Sunday, January 1, 2023 | 1814617000 | 11820400000 |
| Monday, January 1, 2024 | 2355943000 | 12757700000 |
Data in motion
In the ever-evolving landscape of industrial innovation, understanding cost structures is pivotal. Trane Technologies plc and HEICO Corporation, two giants in their respective fields, offer a fascinating glimpse into how expenses have evolved over the past decade. From 2014 to 2023, HEICO Corporation's cost of revenue surged by over 220%, reflecting its aggressive expansion and adaptation strategies. Meanwhile, Trane Technologies plc maintained a steady growth trajectory, with costs increasing by approximately 32% during the same period. Notably, 2020 marked a dip for Trane Technologies, likely due to global disruptions, but it rebounded strongly in subsequent years. The data for 2024 remains incomplete, highlighting the dynamic nature of financial forecasting. This analysis underscores the importance of strategic cost management in sustaining competitive advantage in the industrial sector.
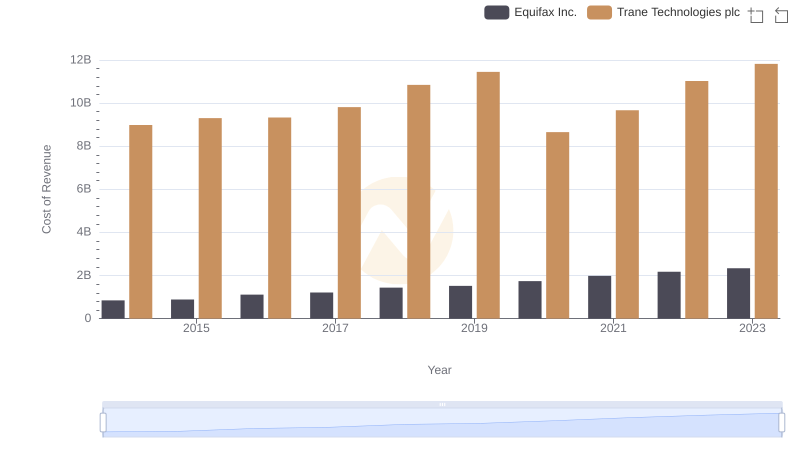
Cost of Revenue Comparison: Trane Technologies plc vs Equifax Inc.
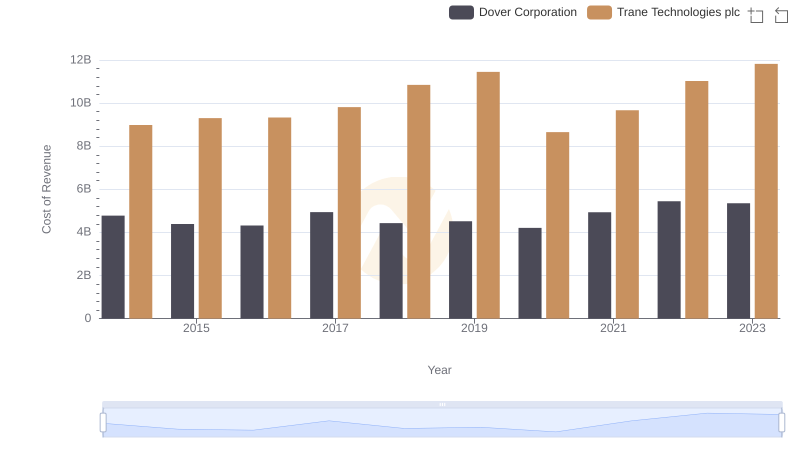
Cost of Revenue: Key Insights for Trane Technologies plc and Dover Corporation
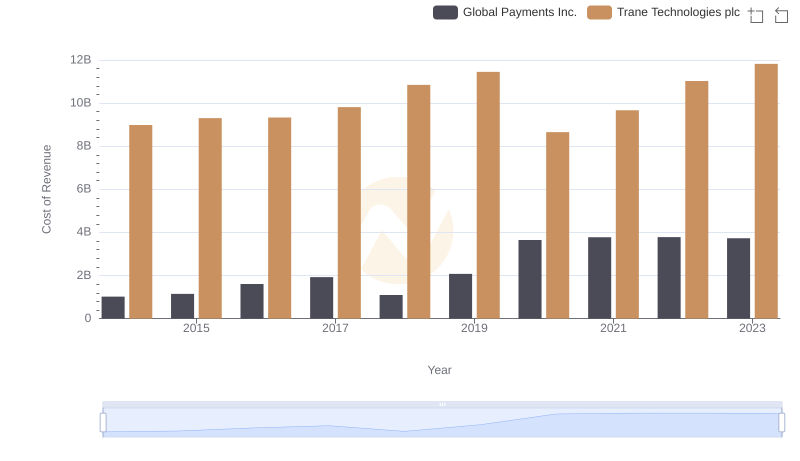
Cost of Revenue Comparison: Trane Technologies plc vs Global Payments Inc.
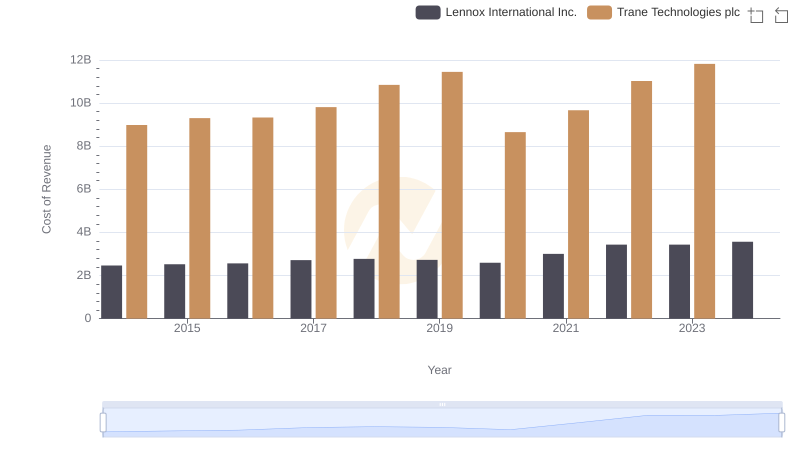
Cost Insights: Breaking Down Trane Technologies plc and Lennox International Inc.'s Expenses
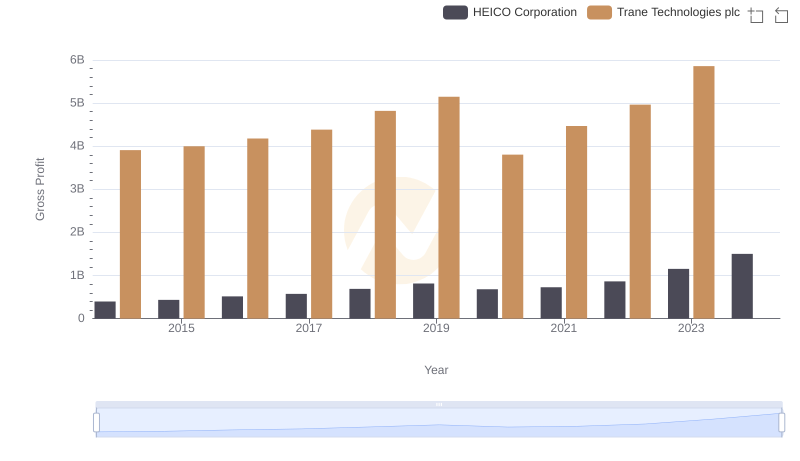
Who Generates Higher Gross Profit? Trane Technologies plc or HEICO Corporation
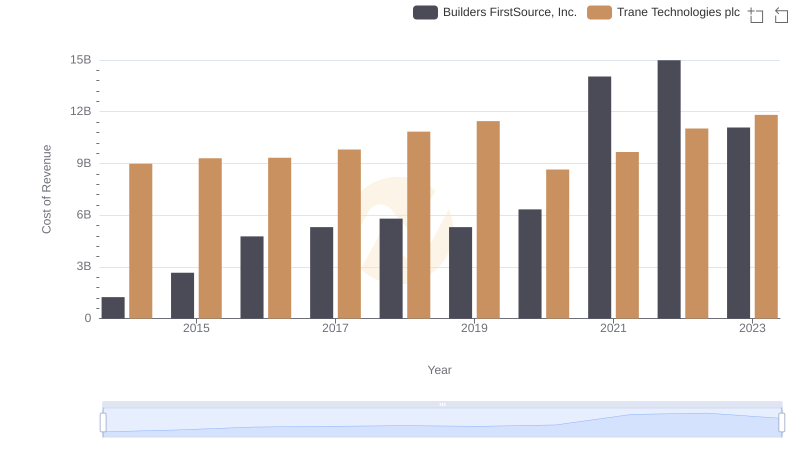
Cost of Revenue: Key Insights for Trane Technologies plc and Builders FirstSource, Inc.
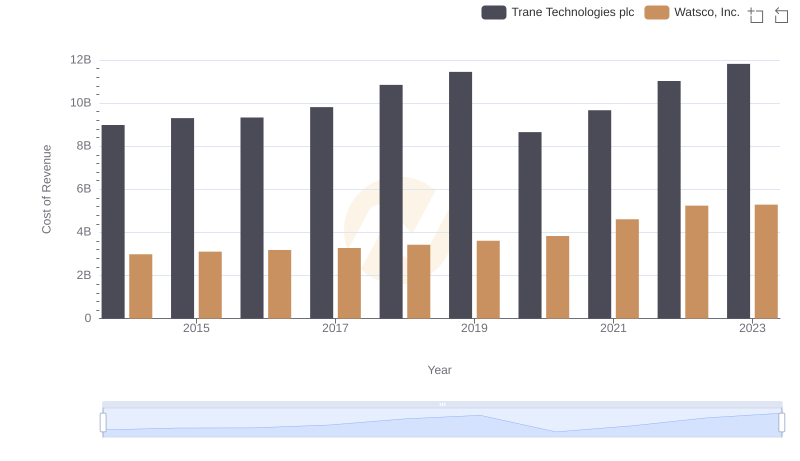
Cost of Revenue Trends: Trane Technologies plc vs Watsco, Inc.
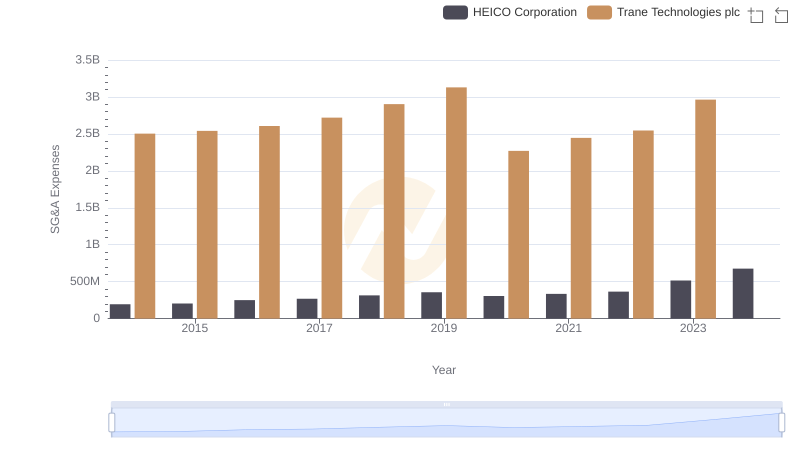
Trane Technologies plc or HEICO Corporation: Who Manages SG&A Costs Better?
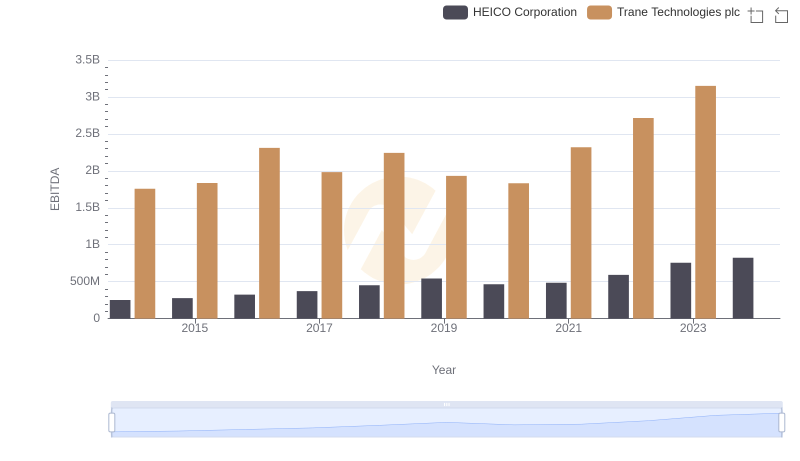
A Professional Review of EBITDA: Trane Technologies plc Compared to HEICO Corporation