| __timestamp | Trane Technologies plc | United Airlines Holdings, Inc. |
|---|---|---|
| Wednesday, January 1, 2014 | 2503900000 | 1373000000 |
| Thursday, January 1, 2015 | 2541100000 | 1342000000 |
| Friday, January 1, 2016 | 2606500000 | 1303000000 |
| Sunday, January 1, 2017 | 2720700000 | 1349000000 |
| Monday, January 1, 2018 | 2903200000 | 1558000000 |
| Tuesday, January 1, 2019 | 3129800000 | 1651000000 |
| Wednesday, January 1, 2020 | 2270600000 | 459000000 |
| Friday, January 1, 2021 | 2446300000 | 677000000 |
| Saturday, January 1, 2022 | 2545900000 | 1535000000 |
| Sunday, January 1, 2023 | 2963200000 | 1977000000 |
| Monday, January 1, 2024 | 3580400000 | 2231000000 |
Infusing magic into the data realm
In the ever-evolving landscape of corporate finance, understanding the trends in Selling, General, and Administrative (SG&A) expenses is crucial for investors and analysts alike. Over the past decade, Trane Technologies plc and United Airlines Holdings, Inc. have showcased distinct trajectories in their SG&A expenditures.
From 2014 to 2023, Trane Technologies saw a steady increase in SG&A expenses, peaking in 2019 with a 25% rise from 2014 levels. Despite a dip in 2020, likely due to global economic disruptions, the company rebounded, reaching nearly 3 billion in 2023. In contrast, United Airlines experienced a more volatile pattern. After a significant drop in 2020, their SG&A expenses surged by over 300% by 2023, reflecting strategic shifts and recovery efforts.
These trends highlight the dynamic nature of corporate strategies and the impact of external factors on financial planning.
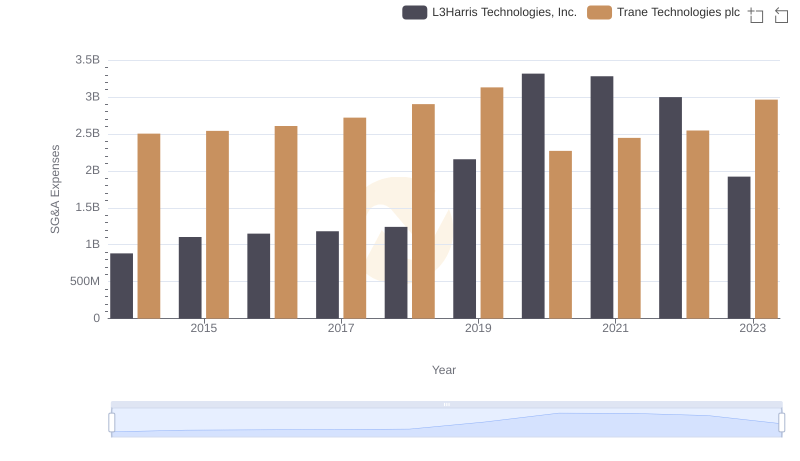
SG&A Efficiency Analysis: Comparing Trane Technologies plc and L3Harris Technologies, Inc.
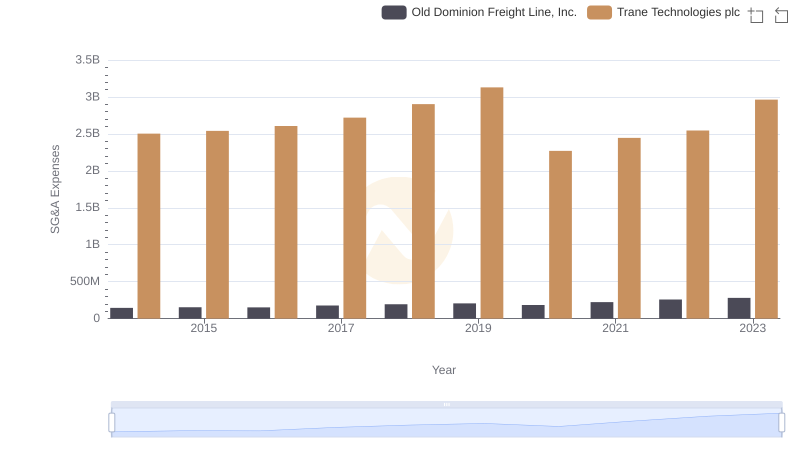
Trane Technologies plc or Old Dominion Freight Line, Inc.: Who Manages SG&A Costs Better?
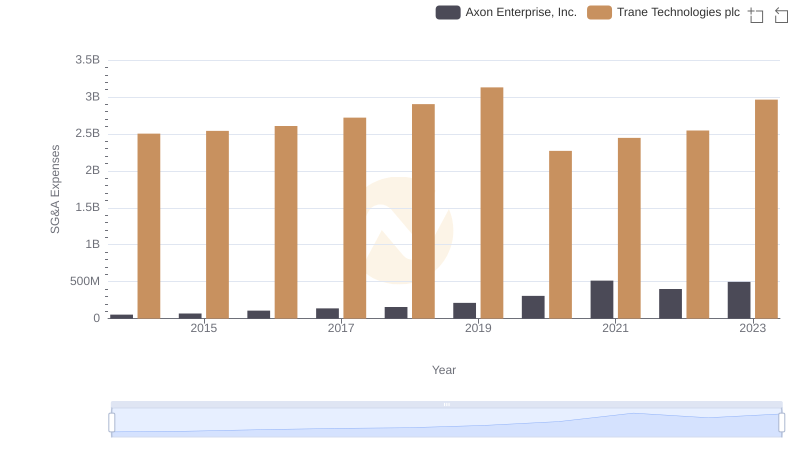
Operational Costs Compared: SG&A Analysis of Trane Technologies plc and Axon Enterprise, Inc.

Comparing Cost of Revenue Efficiency: Trane Technologies plc vs United Airlines Holdings, Inc.
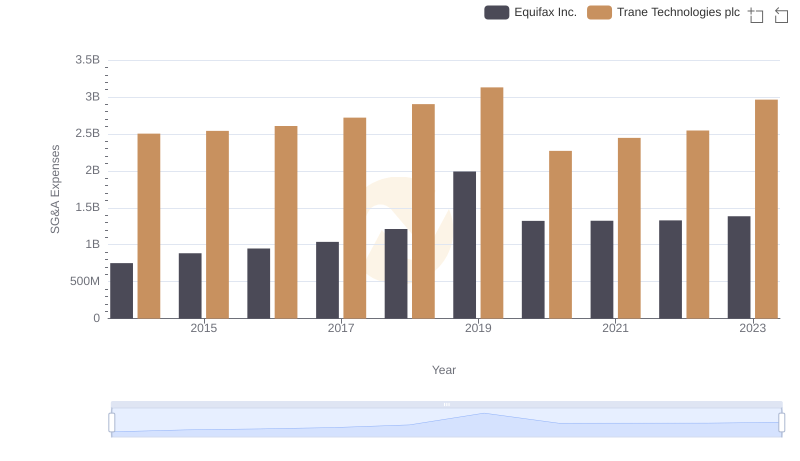
Breaking Down SG&A Expenses: Trane Technologies plc vs Equifax Inc.
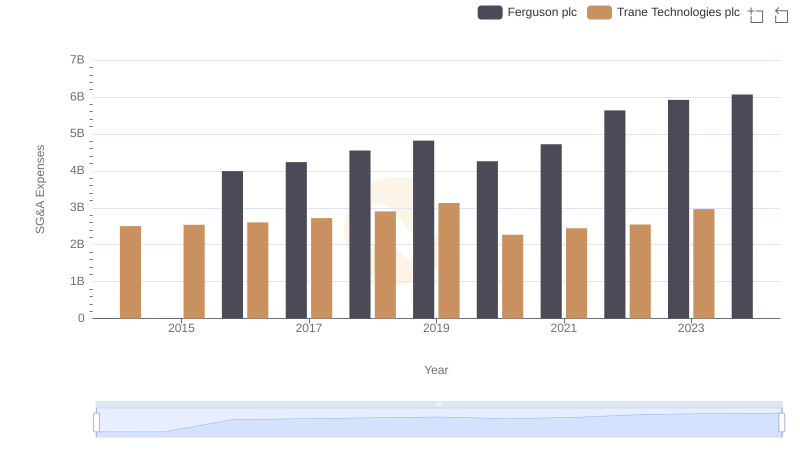
Trane Technologies plc vs Ferguson plc: SG&A Expense Trends
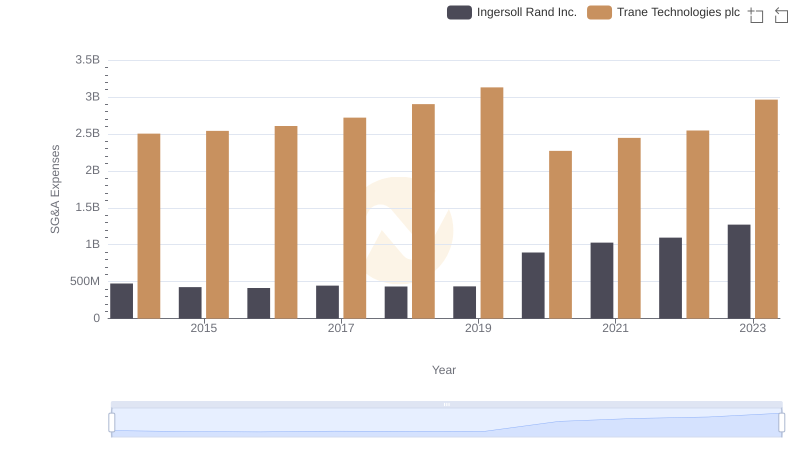
Comparing SG&A Expenses: Trane Technologies plc vs Ingersoll Rand Inc. Trends and Insights
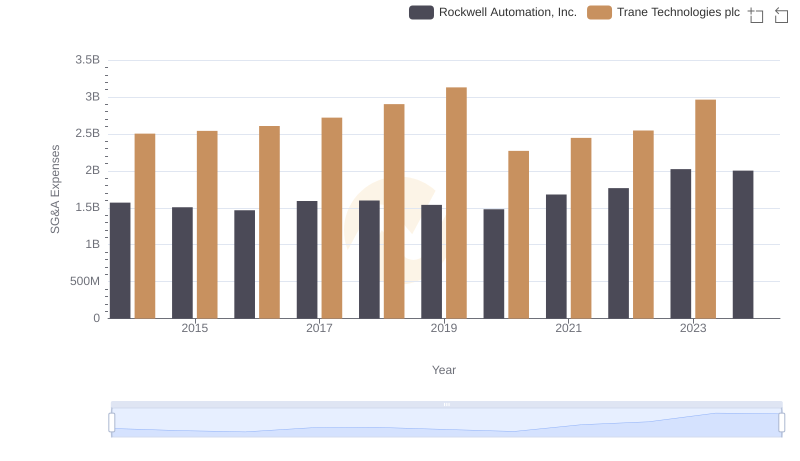
SG&A Efficiency Analysis: Comparing Trane Technologies plc and Rockwell Automation, Inc.
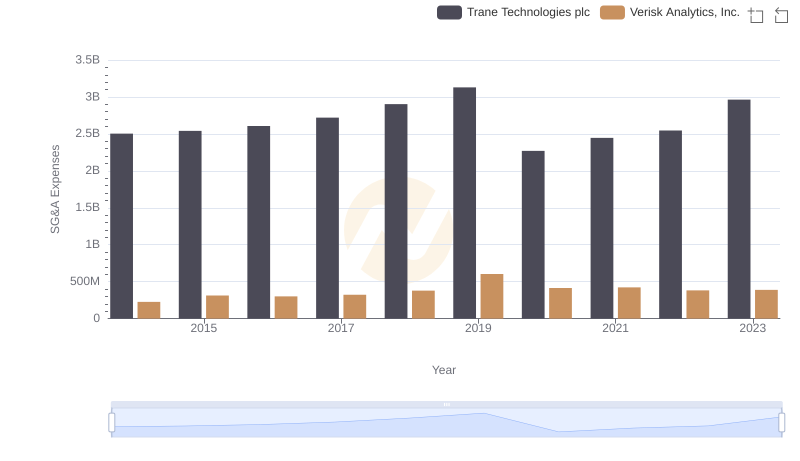
Cost Management Insights: SG&A Expenses for Trane Technologies plc and Verisk Analytics, Inc.