| __timestamp | IDEX Corporation | Trane Technologies plc |
|---|---|---|
| Wednesday, January 1, 2014 | 1198452000 | 8982800000 |
| Thursday, January 1, 2015 | 1116353000 | 9301600000 |
| Friday, January 1, 2016 | 1182276000 | 9329300000 |
| Sunday, January 1, 2017 | 1260634000 | 9811600000 |
| Monday, January 1, 2018 | 1365771000 | 10847600000 |
| Tuesday, January 1, 2019 | 1369539000 | 11451500000 |
| Wednesday, January 1, 2020 | 1324222000 | 8651300000 |
| Friday, January 1, 2021 | 1540300000 | 9666800000 |
| Saturday, January 1, 2022 | 1755000000 | 11026900000 |
| Sunday, January 1, 2023 | 1825400000 | 11820400000 |
| Monday, January 1, 2024 | 1814000000 | 12757700000 |
Igniting the spark of knowledge
In the competitive landscape of industrial manufacturing, Trane Technologies plc and IDEX Corporation have showcased distinct trajectories in cost of revenue efficiency over the past decade. From 2014 to 2023, Trane Technologies consistently outpaced IDEX, with its cost of revenue peaking at approximately $11.8 billion in 2023, a 32% increase from 2014. In contrast, IDEX Corporation's cost of revenue grew by 52% over the same period, reaching around $1.8 billion in 2023. This disparity highlights Trane's larger scale and operational efficiency, despite IDEX's faster growth rate. The data underscores the strategic differences between these two industry leaders, with Trane leveraging its size for stability and IDEX focusing on agile expansion. As the industrial sector evolves, these trends offer valuable insights into the financial strategies shaping the future of manufacturing.
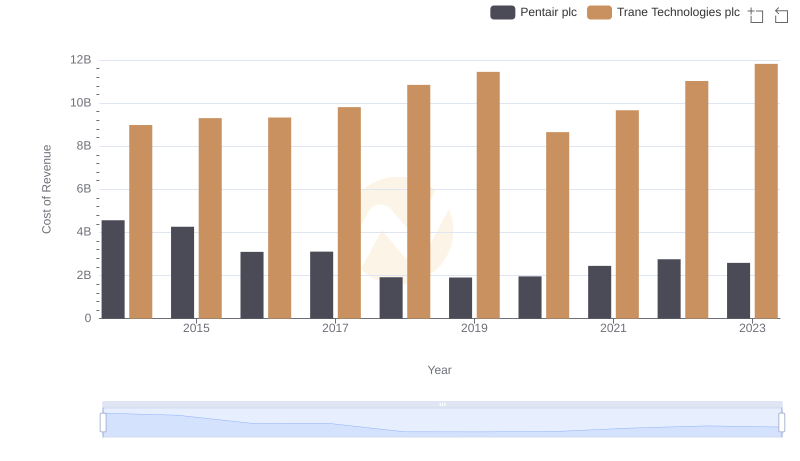
Analyzing Cost of Revenue: Trane Technologies plc and Pentair plc
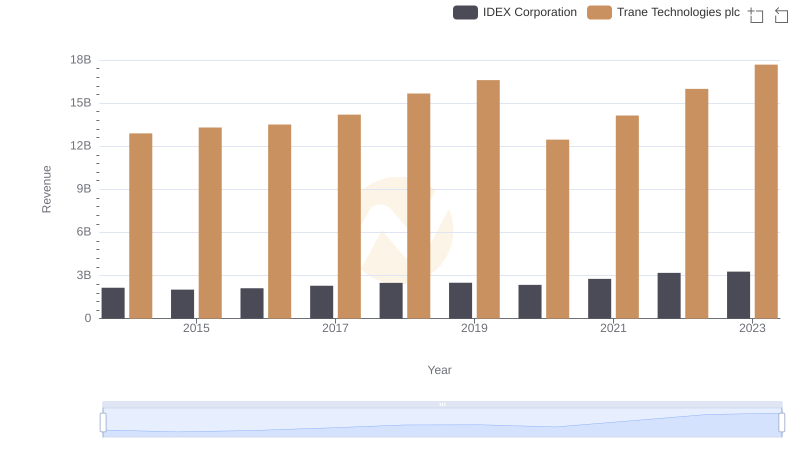
Who Generates More Revenue? Trane Technologies plc or IDEX Corporation
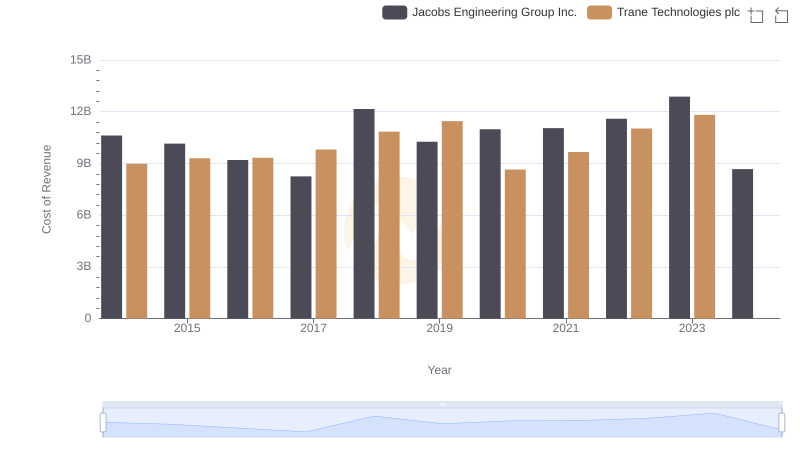
Comparing Cost of Revenue Efficiency: Trane Technologies plc vs Jacobs Engineering Group Inc.
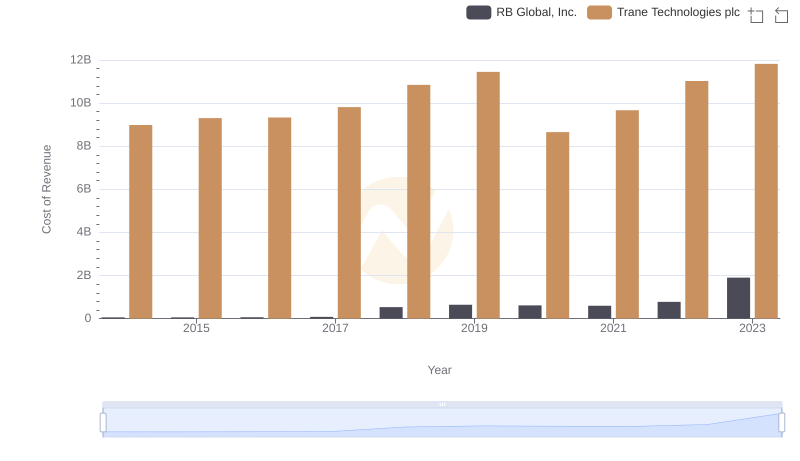
Cost Insights: Breaking Down Trane Technologies plc and RB Global, Inc.'s Expenses
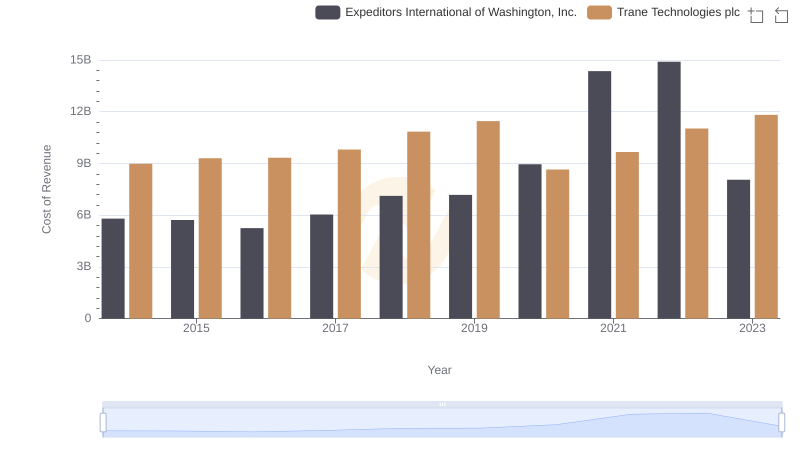
Analyzing Cost of Revenue: Trane Technologies plc and Expeditors International of Washington, Inc.
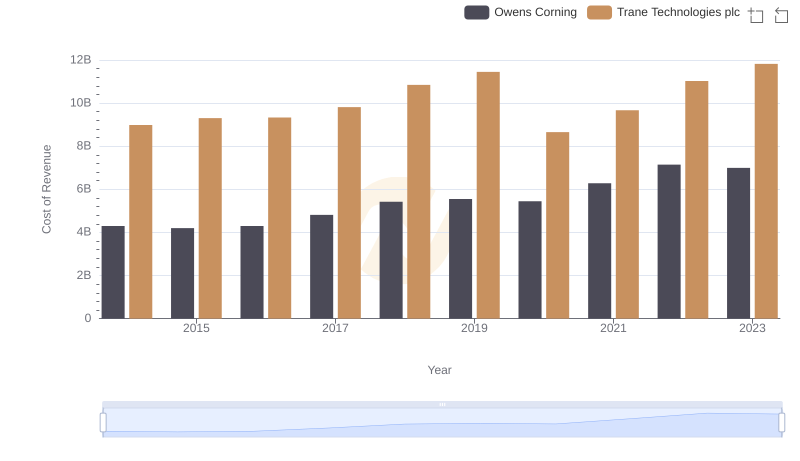
Cost Insights: Breaking Down Trane Technologies plc and Owens Corning's Expenses
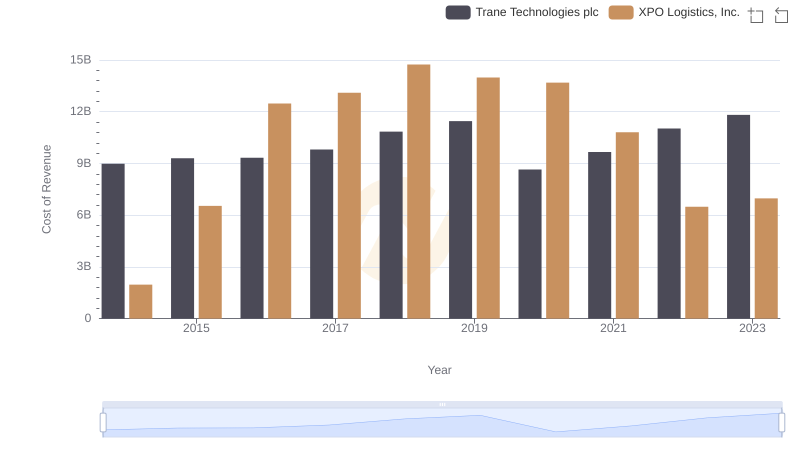
Cost of Revenue Trends: Trane Technologies plc vs XPO Logistics, Inc.
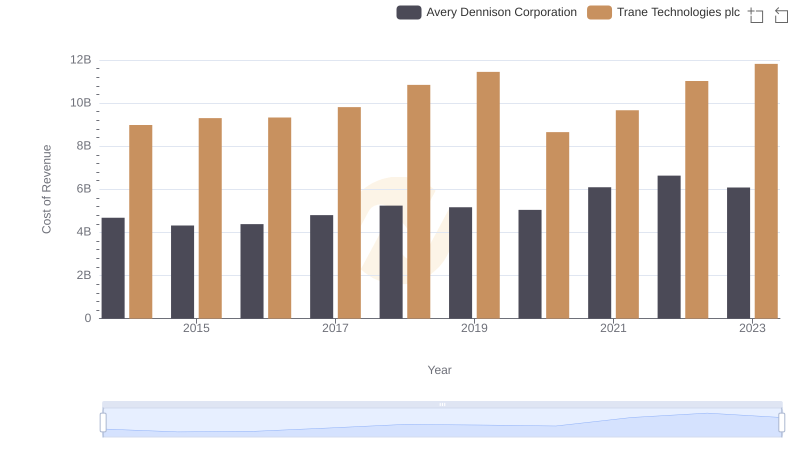
Comparing Cost of Revenue Efficiency: Trane Technologies plc vs Avery Dennison Corporation
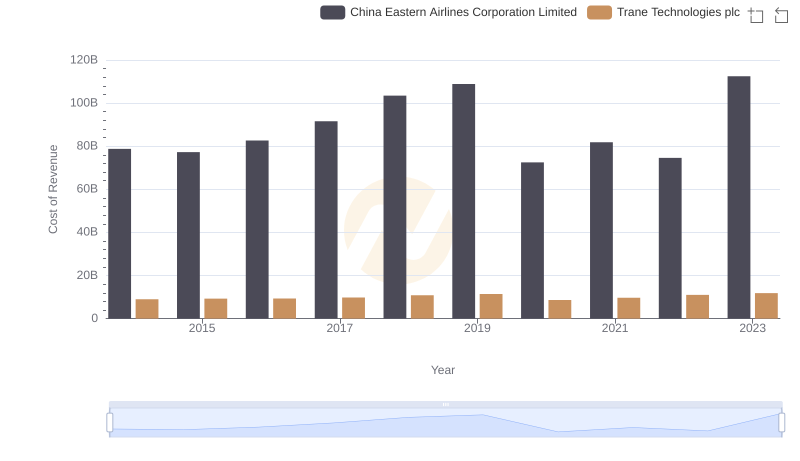
Cost Insights: Breaking Down Trane Technologies plc and China Eastern Airlines Corporation Limited's Expenses
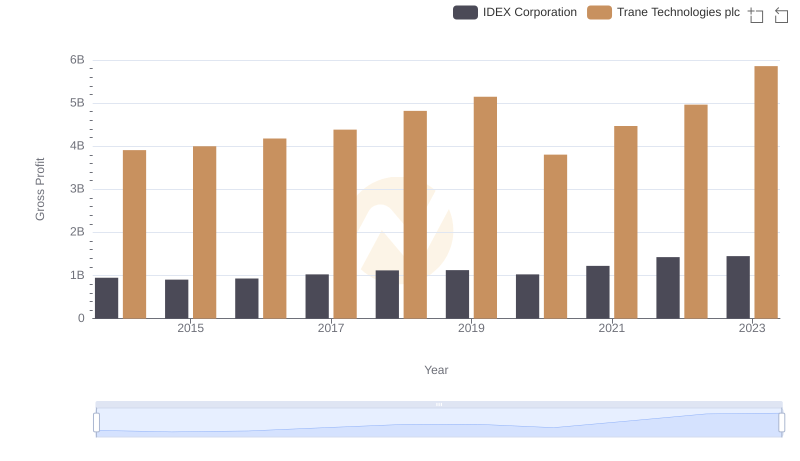
Trane Technologies plc vs IDEX Corporation: A Gross Profit Performance Breakdown
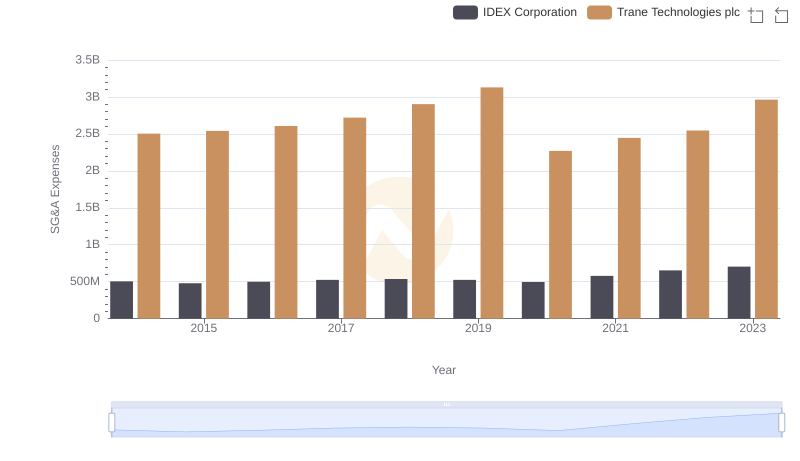
Trane Technologies plc vs IDEX Corporation: SG&A Expense Trends
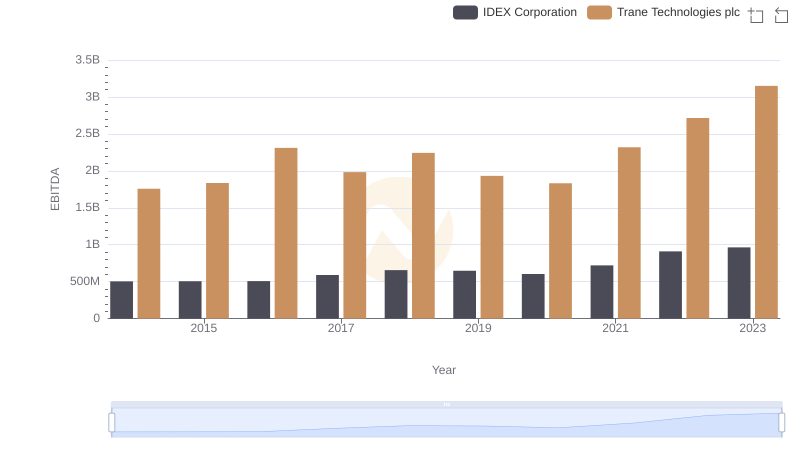
Professional EBITDA Benchmarking: Trane Technologies plc vs IDEX Corporation