| __timestamp | Jacobs Engineering Group Inc. | Trane Technologies plc |
|---|---|---|
| Wednesday, January 1, 2014 | 1545716000 | 2503900000 |
| Thursday, January 1, 2015 | 1522811000 | 2541100000 |
| Friday, January 1, 2016 | 1429233000 | 2606500000 |
| Sunday, January 1, 2017 | 1379983000 | 2720700000 |
| Monday, January 1, 2018 | 2180399000 | 2903200000 |
| Tuesday, January 1, 2019 | 2072177000 | 3129800000 |
| Wednesday, January 1, 2020 | 2050695000 | 2270600000 |
| Friday, January 1, 2021 | 2355683000 | 2446300000 |
| Saturday, January 1, 2022 | 2409190000 | 2545900000 |
| Sunday, January 1, 2023 | 2398078000 | 2963200000 |
| Monday, January 1, 2024 | 2140320000 | 3580400000 |
Igniting the spark of knowledge
In the ever-evolving landscape of corporate finance, understanding the nuances of Selling, General, and Administrative (SG&A) expenses is crucial. Over the past decade, Trane Technologies plc and Jacobs Engineering Group Inc. have showcased distinct trajectories in their SG&A expenditures. From 2014 to 2023, Trane Technologies consistently outpaced Jacobs Engineering, with SG&A expenses peaking in 2019 at approximately 3.13 billion USD. This represents a 25% increase from their 2014 figures. In contrast, Jacobs Engineering saw a more modest rise, with their highest recorded expenses in 2022, marking a 56% increase from their 2014 baseline. Notably, 2024 data for Trane Technologies is missing, leaving room for speculation on future trends. This analysis not only highlights the financial strategies of these industry giants but also underscores the importance of efficient cost management in maintaining competitive advantage.
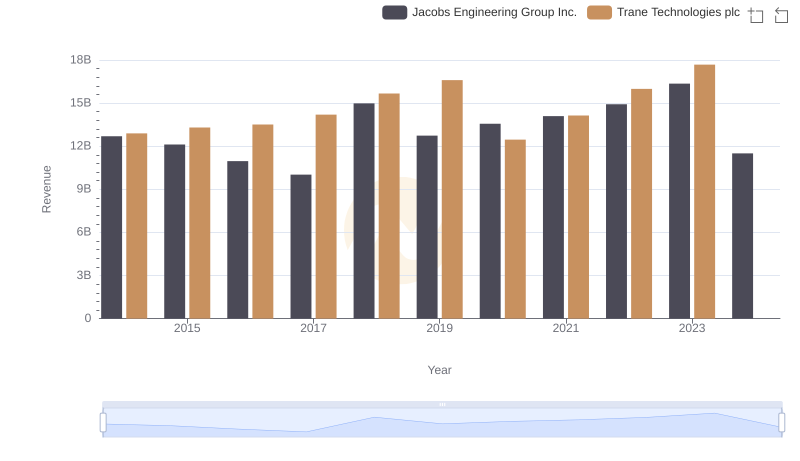
Annual Revenue Comparison: Trane Technologies plc vs Jacobs Engineering Group Inc.
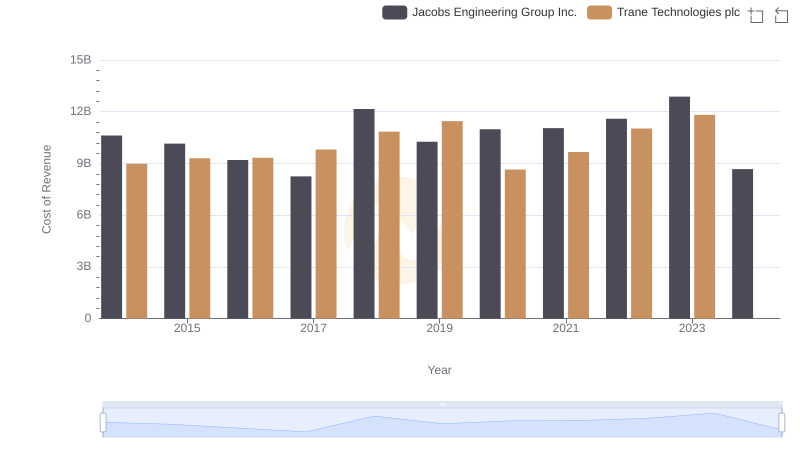
Comparing Cost of Revenue Efficiency: Trane Technologies plc vs Jacobs Engineering Group Inc.
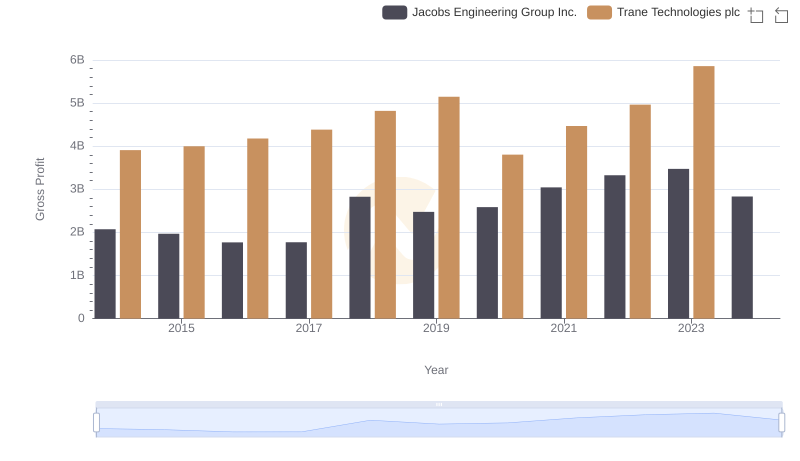
Who Generates Higher Gross Profit? Trane Technologies plc or Jacobs Engineering Group Inc.
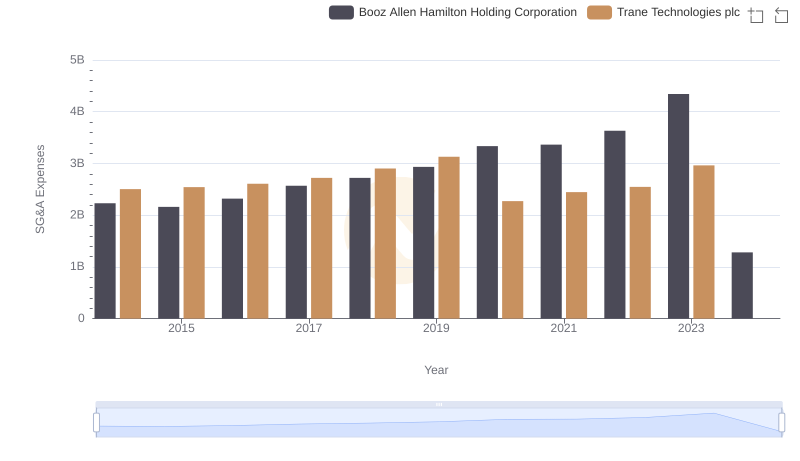
Trane Technologies plc and Booz Allen Hamilton Holding Corporation: SG&A Spending Patterns Compared
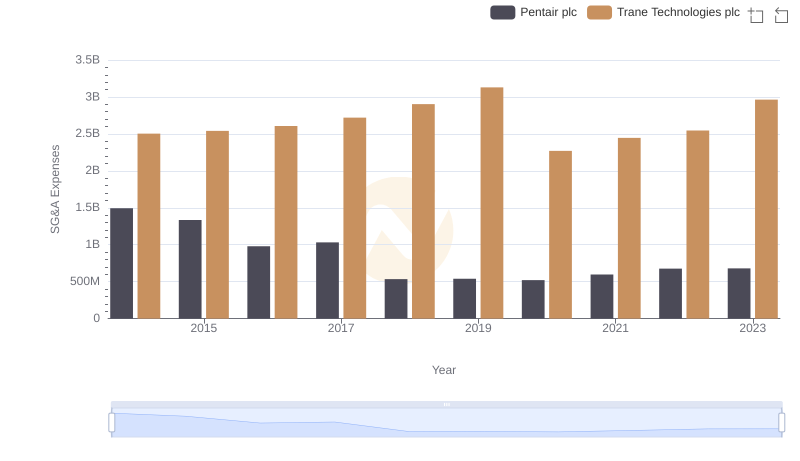
SG&A Efficiency Analysis: Comparing Trane Technologies plc and Pentair plc
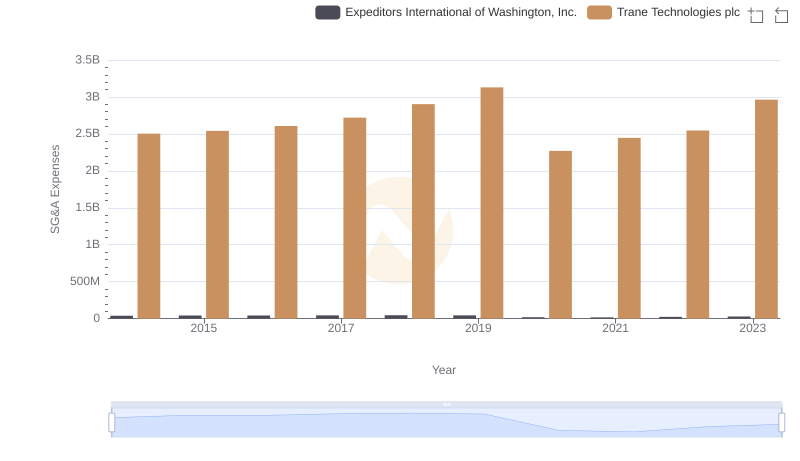
Breaking Down SG&A Expenses: Trane Technologies plc vs Expeditors International of Washington, Inc.
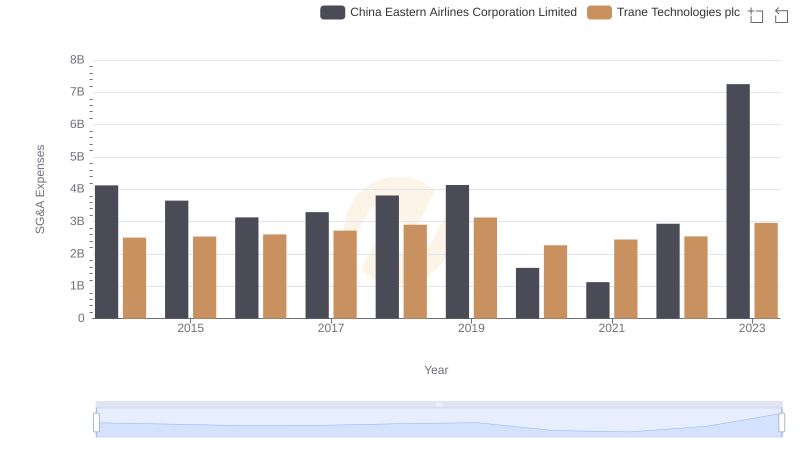
Comparing SG&A Expenses: Trane Technologies plc vs China Eastern Airlines Corporation Limited Trends and Insights
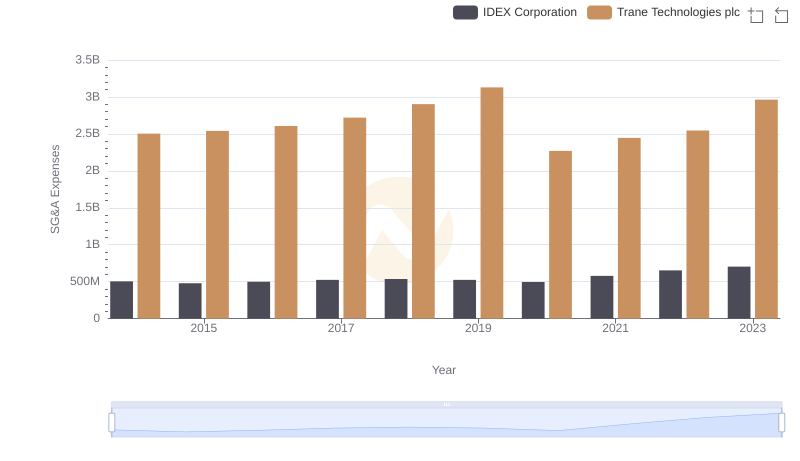
Trane Technologies plc vs IDEX Corporation: SG&A Expense Trends
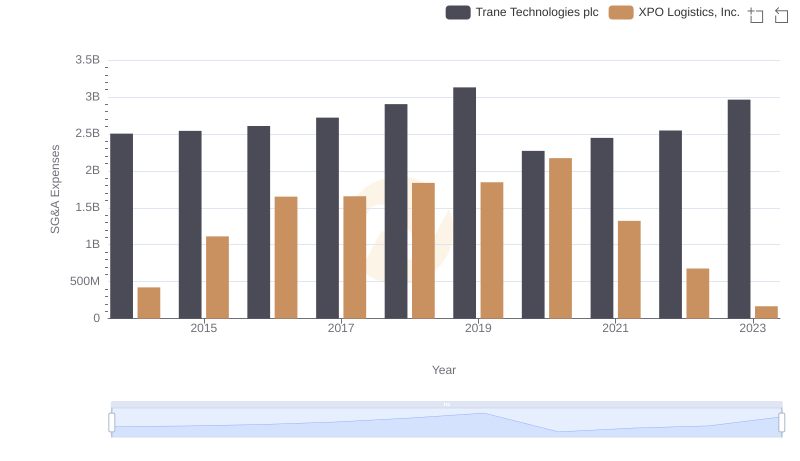
Cost Management Insights: SG&A Expenses for Trane Technologies plc and XPO Logistics, Inc.
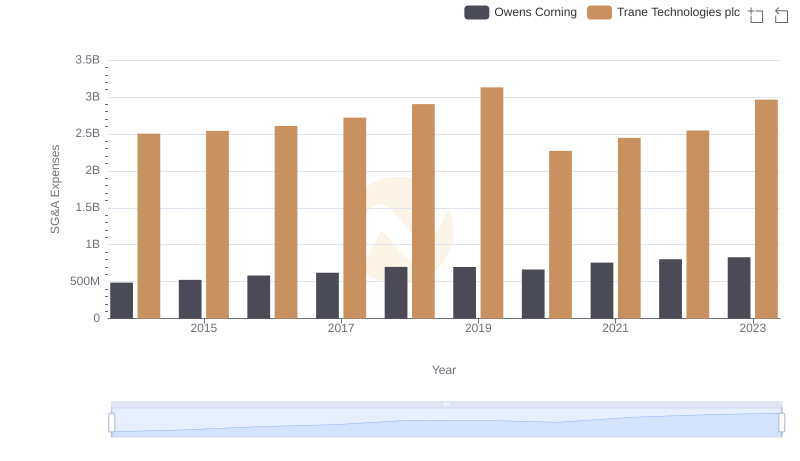
Trane Technologies plc or Owens Corning: Who Manages SG&A Costs Better?
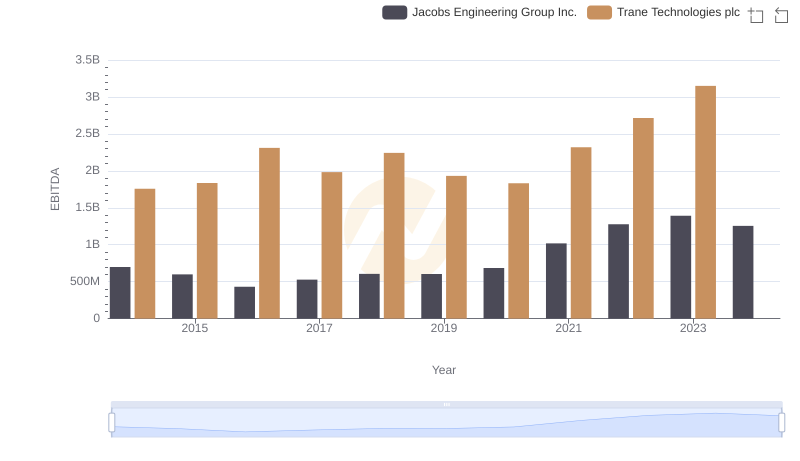
EBITDA Analysis: Evaluating Trane Technologies plc Against Jacobs Engineering Group Inc.