| __timestamp | Carlisle Companies Incorporated | Trane Technologies plc |
|---|---|---|
| Wednesday, January 1, 2014 | 512300000 | 1757000000 |
| Thursday, January 1, 2015 | 631900000 | 1835000000 |
| Friday, January 1, 2016 | 580200000 | 2311000000 |
| Sunday, January 1, 2017 | 609300000 | 1982500000 |
| Monday, January 1, 2018 | 696100000 | 2242400000 |
| Tuesday, January 1, 2019 | 851000000 | 1931200000 |
| Wednesday, January 1, 2020 | 733100000 | 1831900000 |
| Friday, January 1, 2021 | 816100000 | 2319200000 |
| Saturday, January 1, 2022 | 1483400000 | 2715500000 |
| Sunday, January 1, 2023 | 1210700000 | 3149900000 |
| Monday, January 1, 2024 | 1356800000 | 3859600000 |
Igniting the spark of knowledge
In the ever-evolving landscape of industrial innovation, Trane Technologies plc and Carlisle Companies Incorporated have emerged as formidable players. Over the past decade, from 2014 to 2023, these companies have showcased remarkable financial resilience and growth, as reflected in their EBITDA performance.
Trane Technologies has consistently outperformed, with its EBITDA growing by approximately 79% from 2014 to 2023. This growth trajectory highlights its strategic focus on sustainable solutions and energy-efficient products. In contrast, Carlisle Companies, while experiencing fluctuations, saw a significant surge in 2022, with a 104% increase compared to 2014, driven by its diversified portfolio and strategic acquisitions.
This comparative analysis not only underscores the dynamic nature of the industrial sector but also offers valuable insights into the strategic maneuvers that have propelled these companies to the forefront of their industry.
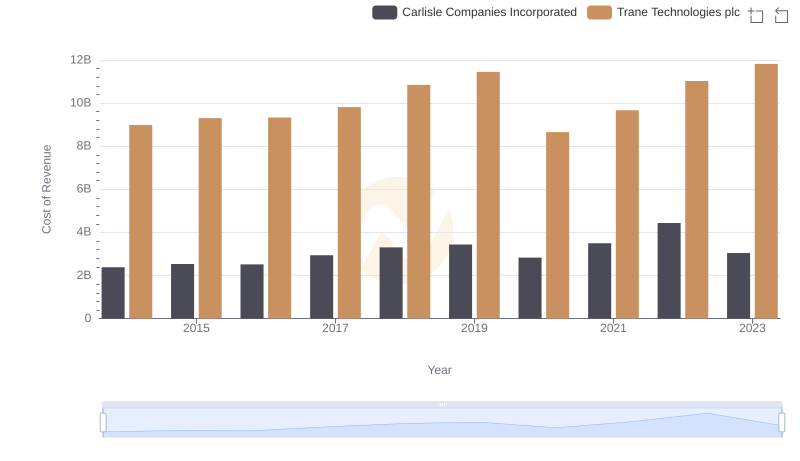
Comparing Cost of Revenue Efficiency: Trane Technologies plc vs Carlisle Companies Incorporated
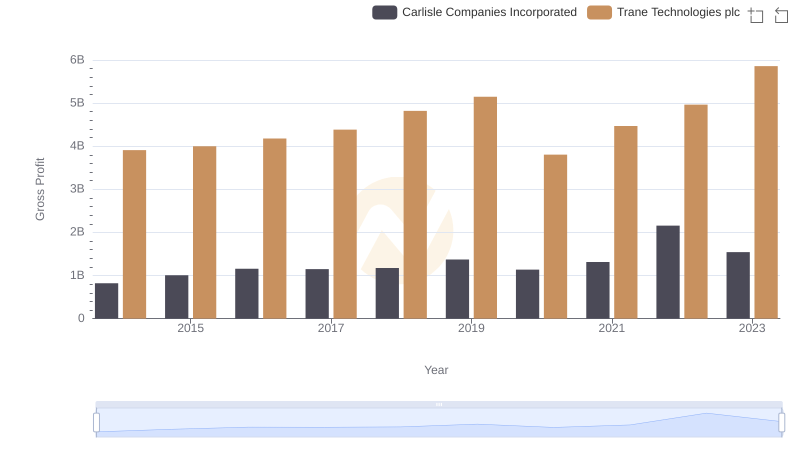
Key Insights on Gross Profit: Trane Technologies plc vs Carlisle Companies Incorporated
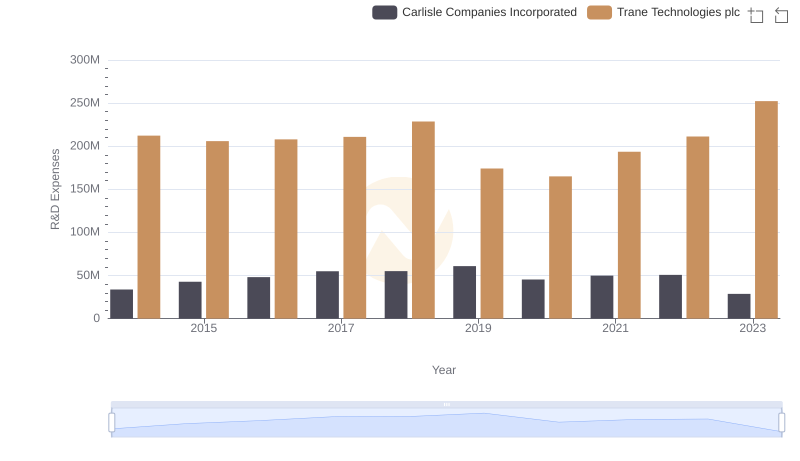
Trane Technologies plc vs Carlisle Companies Incorporated: Strategic Focus on R&D Spending
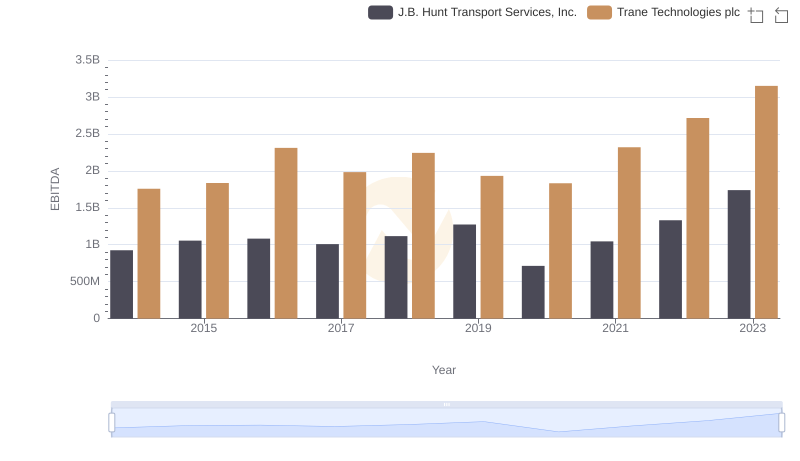
EBITDA Metrics Evaluated: Trane Technologies plc vs J.B. Hunt Transport Services, Inc.
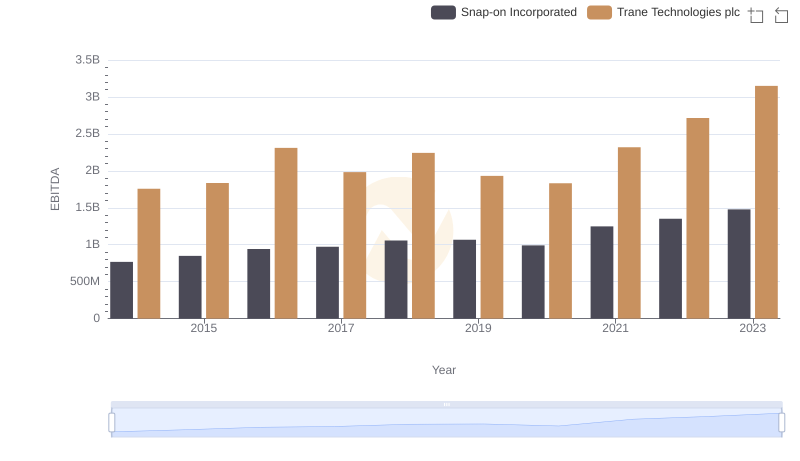
A Professional Review of EBITDA: Trane Technologies plc Compared to Snap-on Incorporated
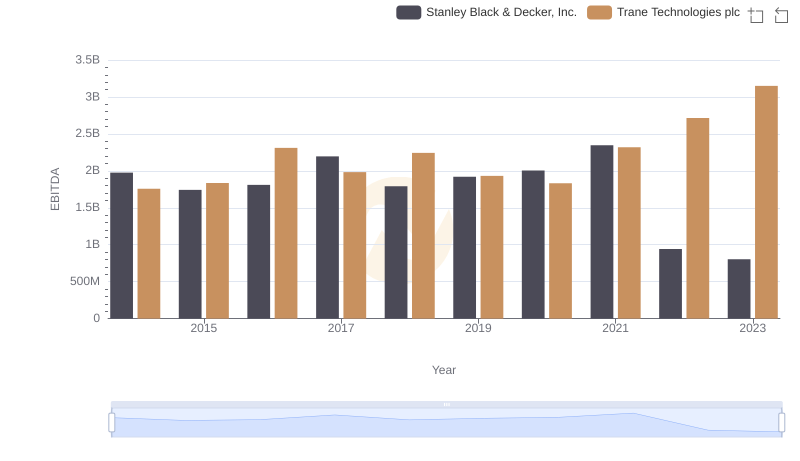
EBITDA Metrics Evaluated: Trane Technologies plc vs Stanley Black & Decker, Inc.

Professional EBITDA Benchmarking: Trane Technologies plc vs Booz Allen Hamilton Holding Corporation
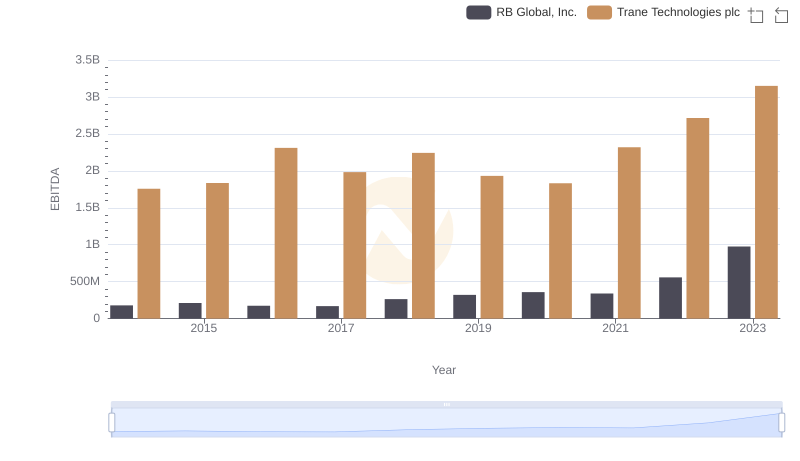
Comprehensive EBITDA Comparison: Trane Technologies plc vs RB Global, Inc.
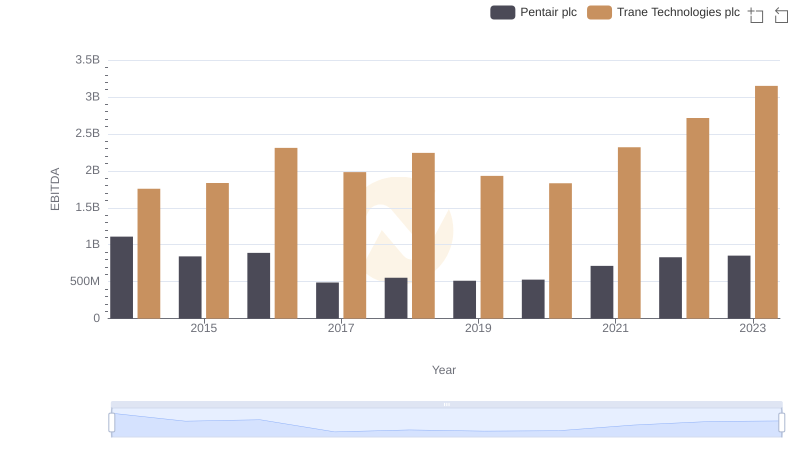
EBITDA Performance Review: Trane Technologies plc vs Pentair plc