| __timestamp | Carlisle Companies Incorporated | Trane Technologies plc |
|---|---|---|
| Wednesday, January 1, 2014 | 819500000 | 3908600000 |
| Thursday, January 1, 2015 | 1006700000 | 3999100000 |
| Friday, January 1, 2016 | 1157300000 | 4179600000 |
| Sunday, January 1, 2017 | 1148000000 | 4386000000 |
| Monday, January 1, 2018 | 1174700000 | 4820600000 |
| Tuesday, January 1, 2019 | 1371700000 | 5147400000 |
| Wednesday, January 1, 2020 | 1137400000 | 3803400000 |
| Friday, January 1, 2021 | 1314700000 | 4469600000 |
| Saturday, January 1, 2022 | 2157400000 | 4964800000 |
| Sunday, January 1, 2023 | 1544000000 | 5857200000 |
| Monday, January 1, 2024 | 1887700000 | 7080500000 |
Igniting the spark of knowledge
In the competitive landscape of industrial manufacturing, Trane Technologies plc and Carlisle Companies Incorporated have showcased distinct trajectories in gross profit over the past decade. From 2014 to 2023, Trane Technologies consistently outperformed Carlisle, with an average gross profit nearly 3.5 times higher. Notably, Trane Technologies saw a remarkable 50% increase in gross profit from 2014 to 2023, peaking in 2023 with a 5.86 billion USD mark. Meanwhile, Carlisle Companies experienced a more volatile journey, with a significant spike in 2022, reaching 2.16 billion USD, before settling at 1.54 billion USD in 2023. This data highlights Trane's robust growth and resilience, while Carlisle's fluctuations suggest a more dynamic market response. As the industrial sector evolves, these insights provide a window into the strategic maneuvers and market conditions shaping these industry giants.
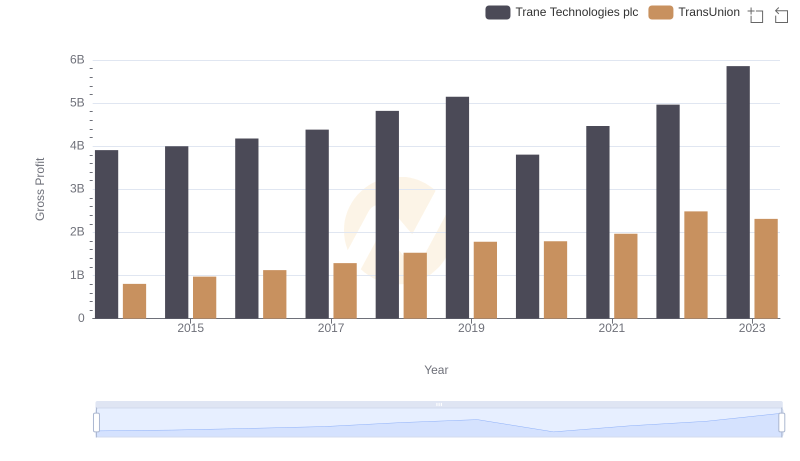
Who Generates Higher Gross Profit? Trane Technologies plc or TransUnion
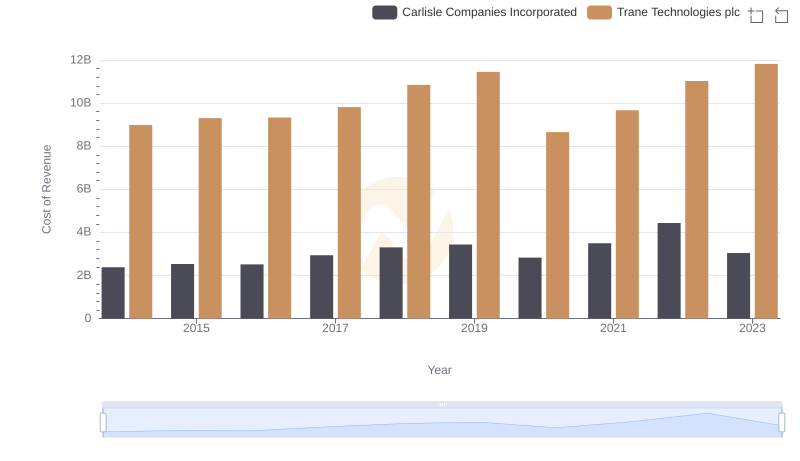
Comparing Cost of Revenue Efficiency: Trane Technologies plc vs Carlisle Companies Incorporated
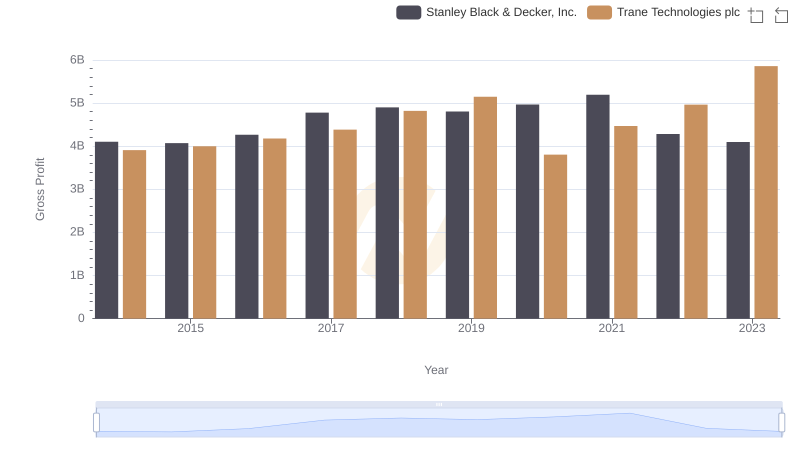
Gross Profit Comparison: Trane Technologies plc and Stanley Black & Decker, Inc. Trends
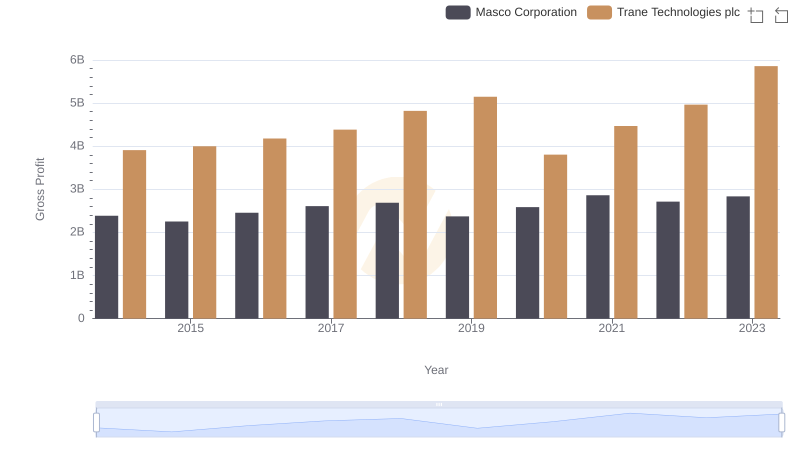
Trane Technologies plc vs Masco Corporation: A Gross Profit Performance Breakdown
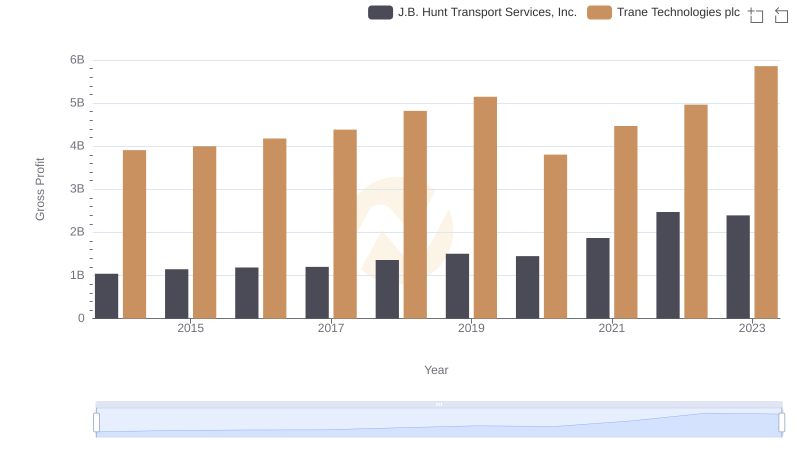
Gross Profit Comparison: Trane Technologies plc and J.B. Hunt Transport Services, Inc. Trends
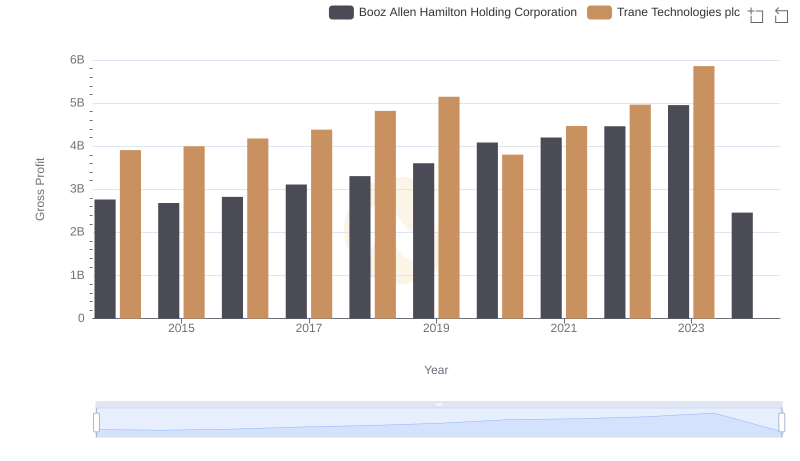
Key Insights on Gross Profit: Trane Technologies plc vs Booz Allen Hamilton Holding Corporation
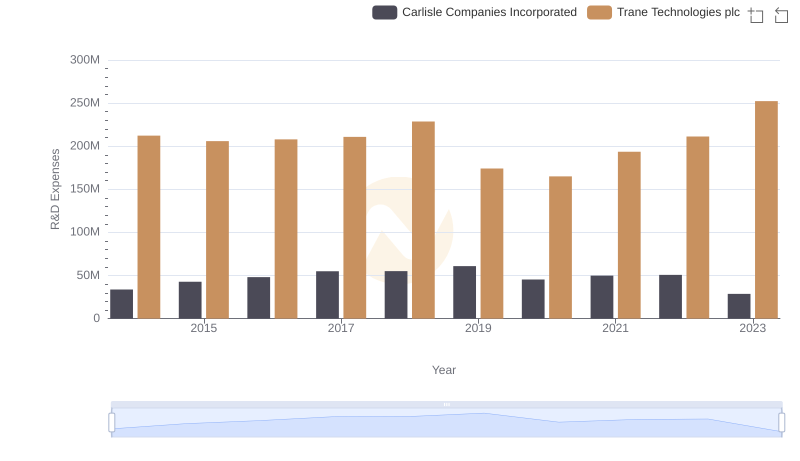
Trane Technologies plc vs Carlisle Companies Incorporated: Strategic Focus on R&D Spending
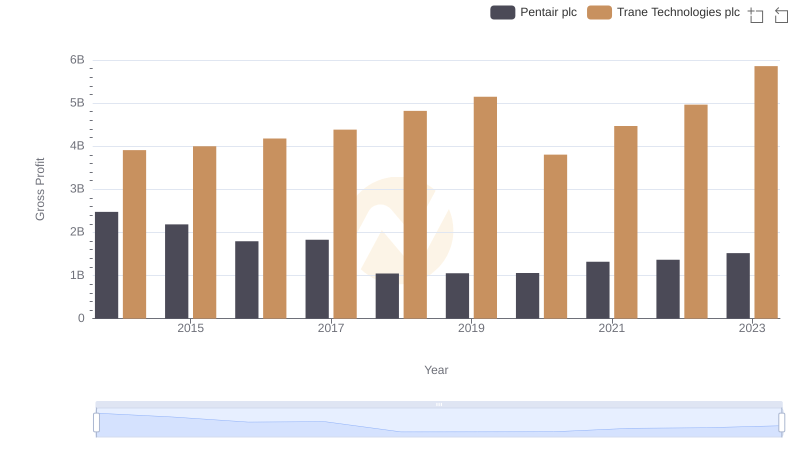
Trane Technologies plc and Pentair plc: A Detailed Gross Profit Analysis
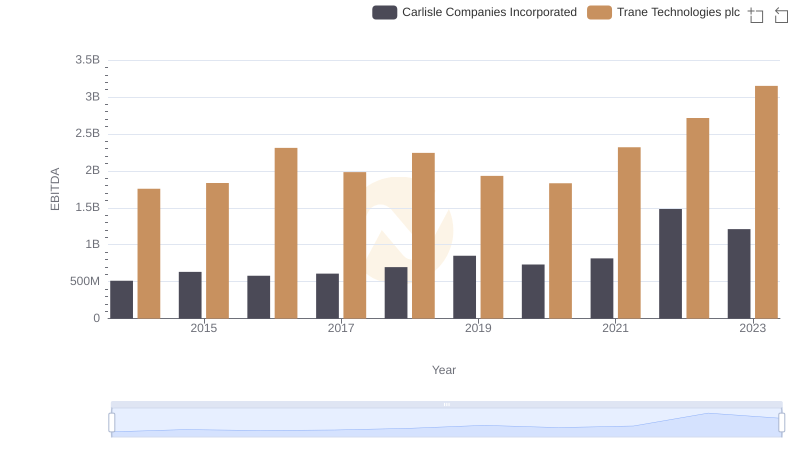
A Professional Review of EBITDA: Trane Technologies plc Compared to Carlisle Companies Incorporated