| __timestamp | Electronic Arts Inc. | International Business Machines Corporation |
|---|---|---|
| Wednesday, January 1, 2014 | 2228000000 | 46407000000 |
| Thursday, January 1, 2015 | 3086000000 | 40684000000 |
| Friday, January 1, 2016 | 3042000000 | 38516000000 |
| Sunday, January 1, 2017 | 3547000000 | 36943000000 |
| Monday, January 1, 2018 | 3873000000 | 36936000000 |
| Tuesday, January 1, 2019 | 3628000000 | 31533000000 |
| Wednesday, January 1, 2020 | 4168000000 | 30865000000 |
| Friday, January 1, 2021 | 4135000000 | 31486000000 |
| Saturday, January 1, 2022 | 5132000000 | 32687000000 |
| Sunday, January 1, 2023 | 5634000000 | 34300000000 |
| Monday, January 1, 2024 | 5852000000 | 35551000000 |
Igniting the spark of knowledge
In the ever-evolving landscape of technology and entertainment, International Business Machines Corporation (IBM) and Electronic Arts Inc. (EA) have carved distinct niches. From 2014 to 2024, IBM's gross profit has shown a steady decline, dropping approximately 23% from its peak in 2014. In contrast, EA has experienced a robust growth trajectory, with its gross profit surging by over 160% during the same period.
IBM, a stalwart in the tech industry, has faced challenges adapting to the rapid shifts in technology demands. Meanwhile, EA, a leader in digital entertainment, has capitalized on the gaming boom, reflecting its strategic agility. This comparison highlights the dynamic nature of industry-specific growth and the importance of innovation in maintaining competitive advantage.
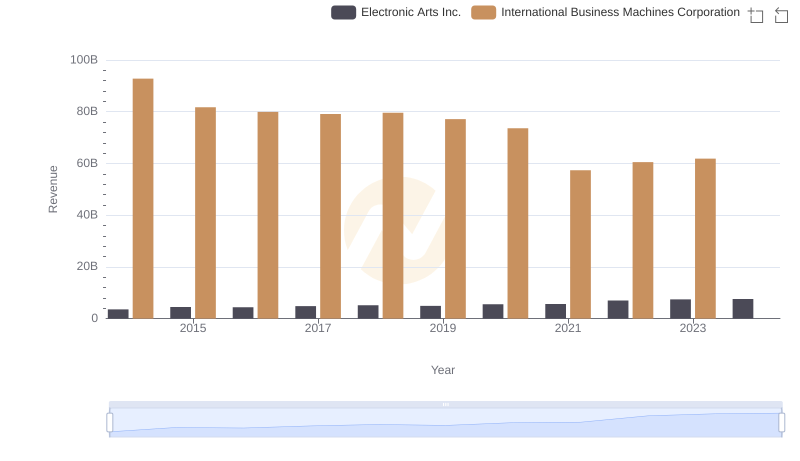
Comparing Revenue Performance: International Business Machines Corporation or Electronic Arts Inc.?
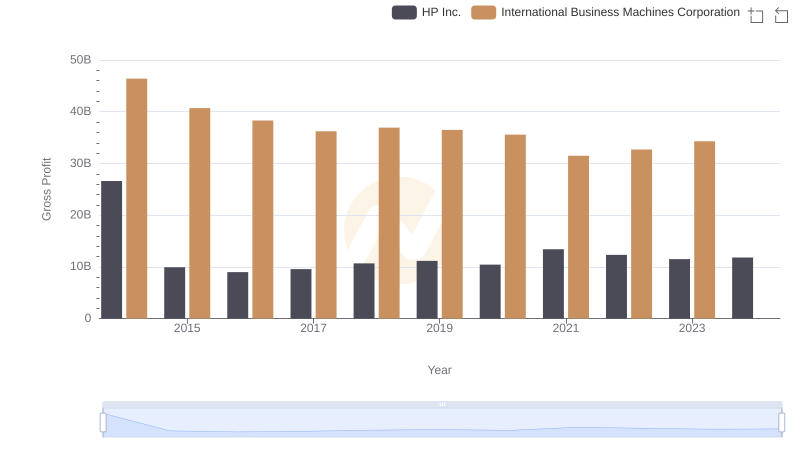
Key Insights on Gross Profit: International Business Machines Corporation vs HP Inc.
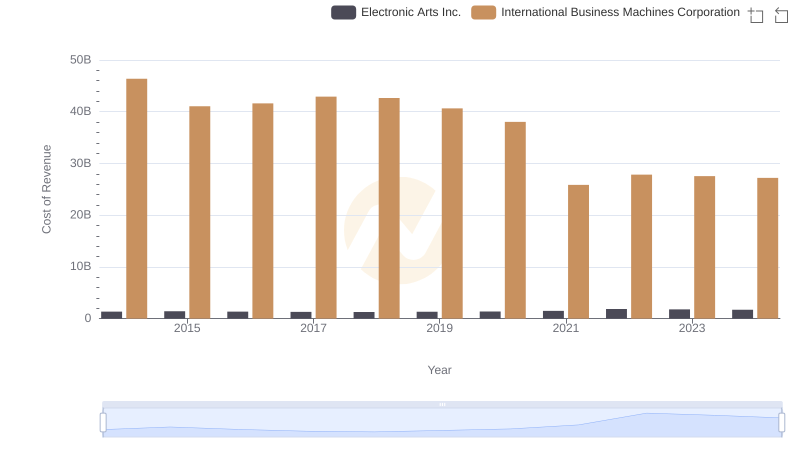
Comparing Cost of Revenue Efficiency: International Business Machines Corporation vs Electronic Arts Inc.
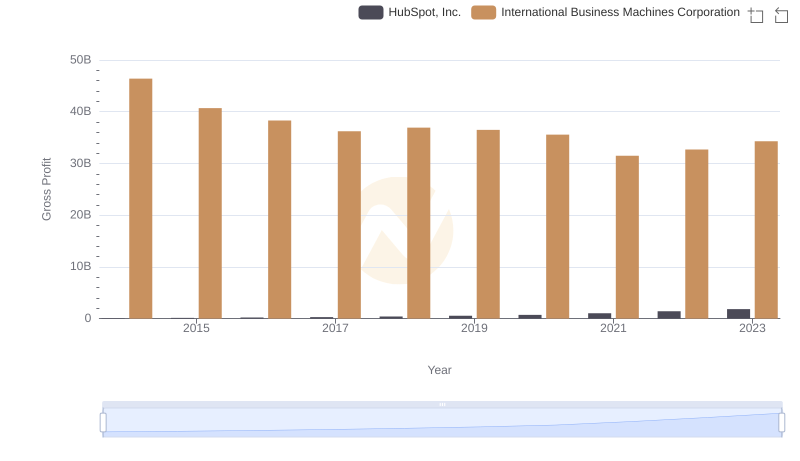
Gross Profit Trends Compared: International Business Machines Corporation vs HubSpot, Inc.
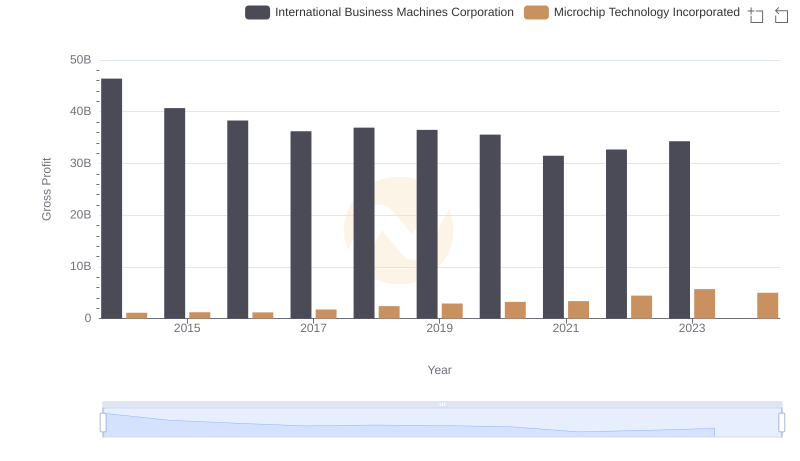
Gross Profit Analysis: Comparing International Business Machines Corporation and Microchip Technology Incorporated
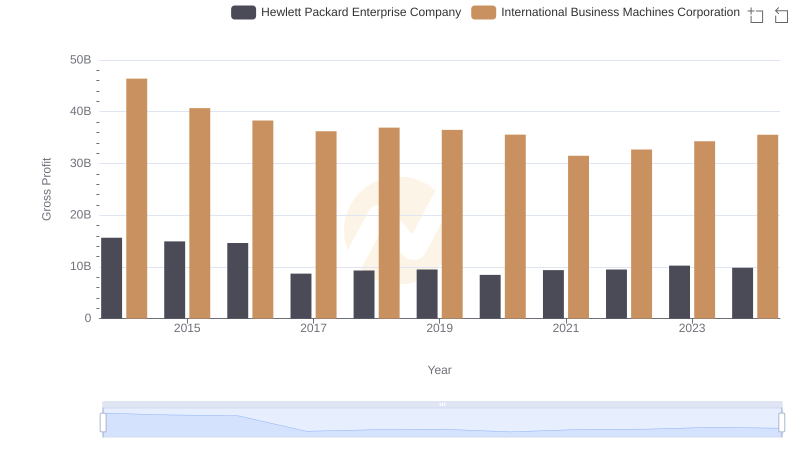
Gross Profit Analysis: Comparing International Business Machines Corporation and Hewlett Packard Enterprise Company
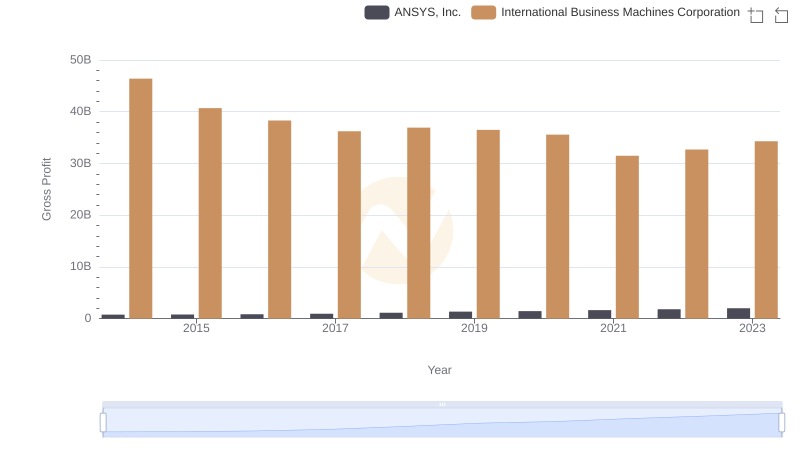
Gross Profit Comparison: International Business Machines Corporation and ANSYS, Inc. Trends
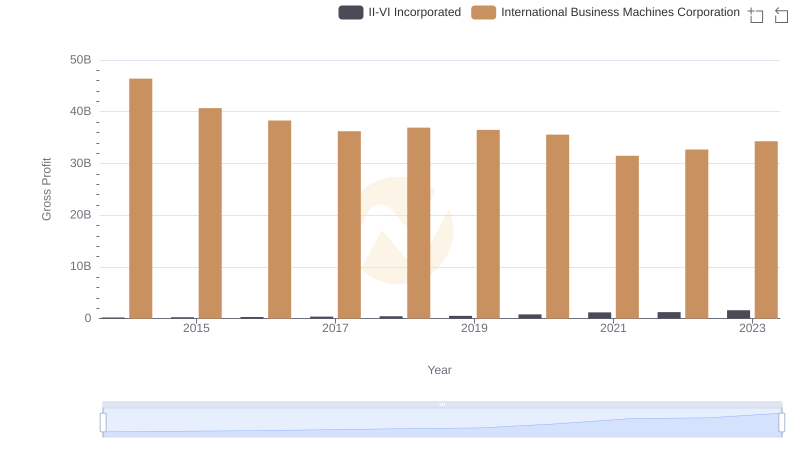
Gross Profit Trends Compared: International Business Machines Corporation vs II-VI Incorporated
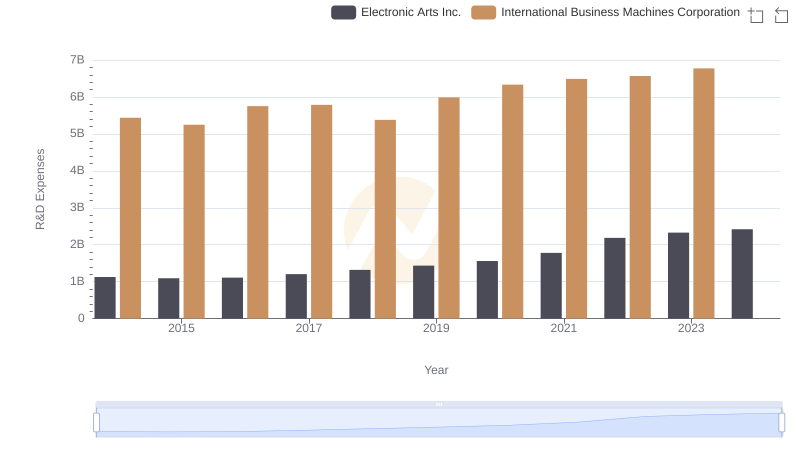
Analyzing R&D Budgets: International Business Machines Corporation vs Electronic Arts Inc.
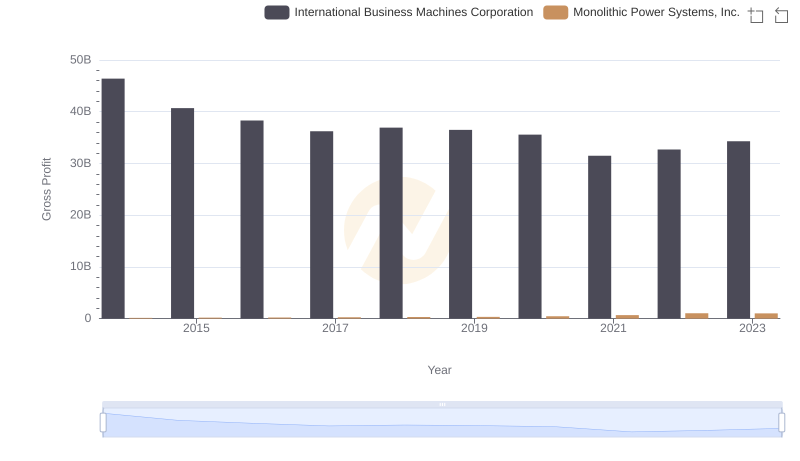
Key Insights on Gross Profit: International Business Machines Corporation vs Monolithic Power Systems, Inc.
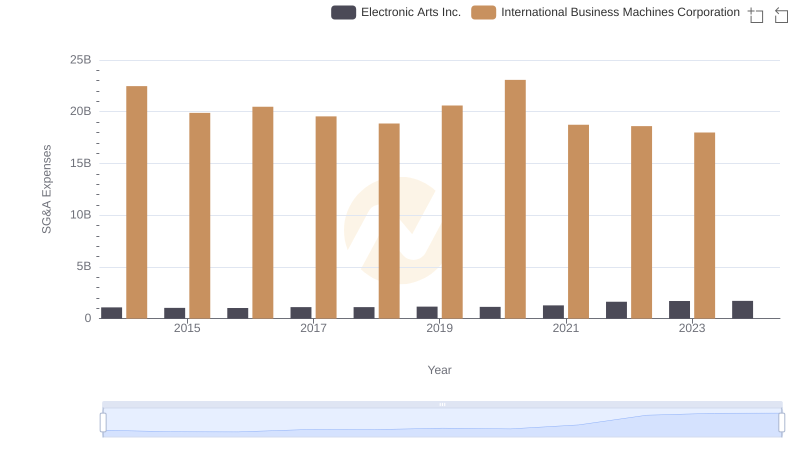
International Business Machines Corporation or Electronic Arts Inc.: Who Manages SG&A Costs Better?
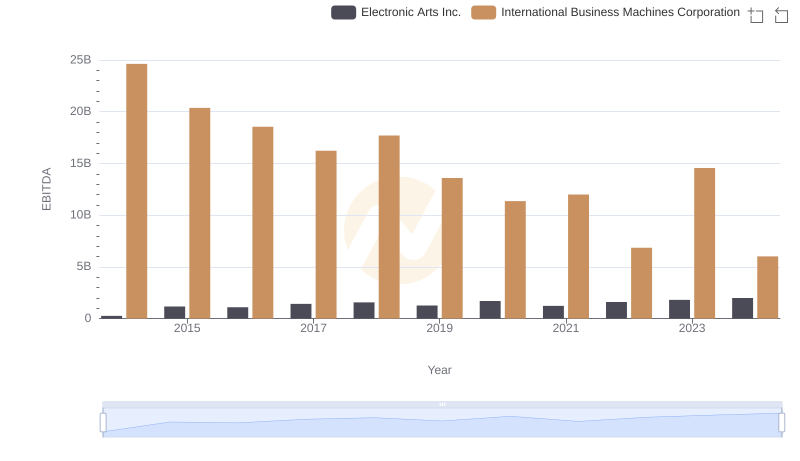
EBITDA Performance Review: International Business Machines Corporation vs Electronic Arts Inc.