| __timestamp | HP Inc. | International Business Machines Corporation |
|---|---|---|
| Wednesday, January 1, 2014 | 84839000000 | 46386000000 |
| Thursday, January 1, 2015 | 41524000000 | 41057000000 |
| Friday, January 1, 2016 | 39240000000 | 41403000000 |
| Sunday, January 1, 2017 | 42478000000 | 42196000000 |
| Monday, January 1, 2018 | 47803000000 | 42655000000 |
| Tuesday, January 1, 2019 | 47586000000 | 26181000000 |
| Wednesday, January 1, 2020 | 46202000000 | 24314000000 |
| Friday, January 1, 2021 | 50070000000 | 25865000000 |
| Saturday, January 1, 2022 | 50648000000 | 27842000000 |
| Sunday, January 1, 2023 | 42210000000 | 27560000000 |
| Monday, January 1, 2024 | 41741000000 | 27202000000 |
Unleashing insights
In the ever-evolving tech industry, understanding cost structures is crucial for strategic planning. This analysis delves into the cost of revenue for two giants: International Business Machines Corporation (IBM) and HP Inc., from 2014 to 2024. Over this decade, HP Inc. consistently outpaced IBM in cost of revenue, peaking in 2014 with a staggering 85% higher cost than IBM. However, both companies have shown a downward trend, with HP Inc. reducing its cost by approximately 51% and IBM by 41% by 2024. This decline reflects strategic shifts towards more efficient operations and possibly a focus on higher-margin services. Notably, 2021 marked a significant dip for IBM, with costs dropping to 26% of its 2014 levels, indicating a pivotal year in its operational strategy. As the tech landscape continues to shift, these insights offer a glimpse into the financial strategies of these industry leaders.
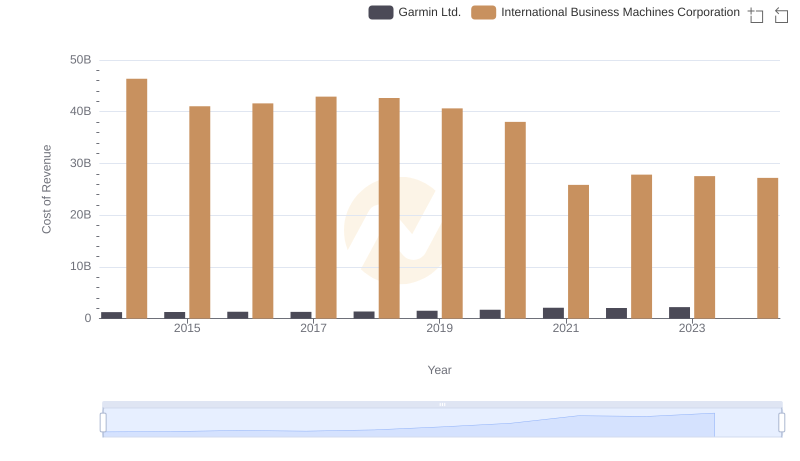
Cost of Revenue Comparison: International Business Machines Corporation vs Garmin Ltd.
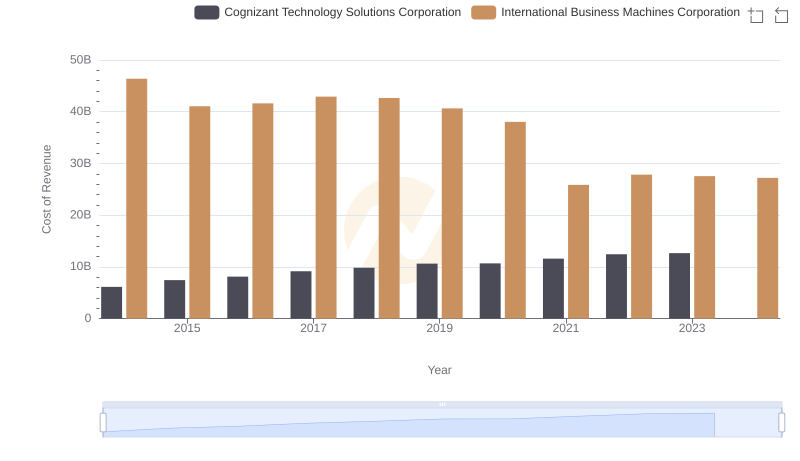
Analyzing Cost of Revenue: International Business Machines Corporation and Cognizant Technology Solutions Corporation
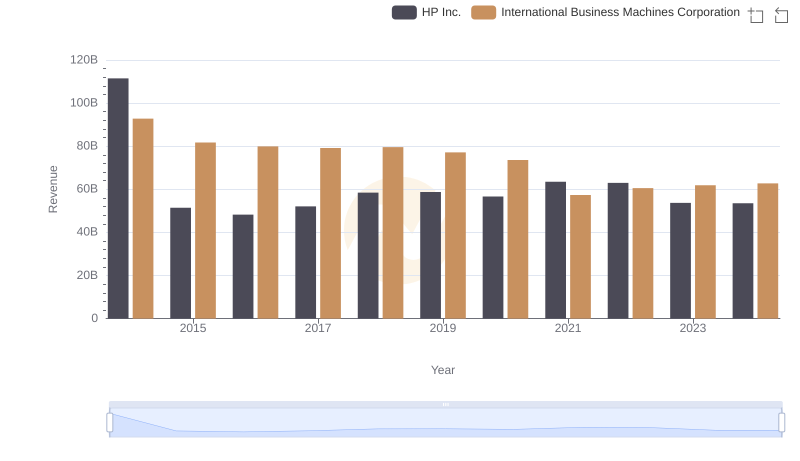
International Business Machines Corporation and HP Inc.: A Comprehensive Revenue Analysis
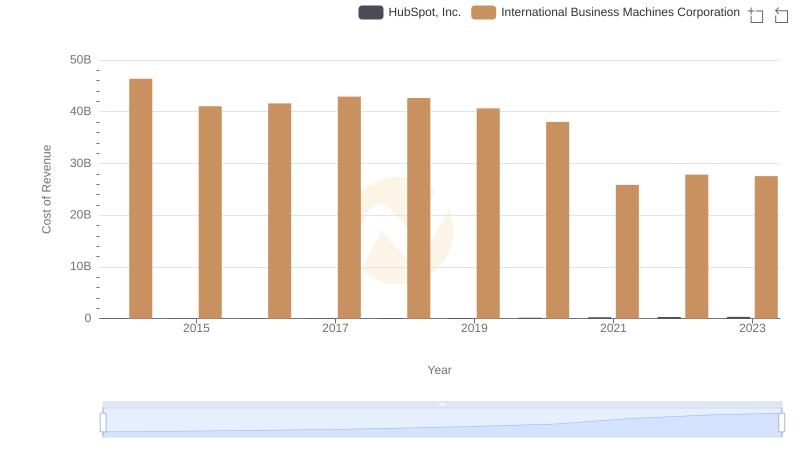
Cost of Revenue Trends: International Business Machines Corporation vs HubSpot, Inc.
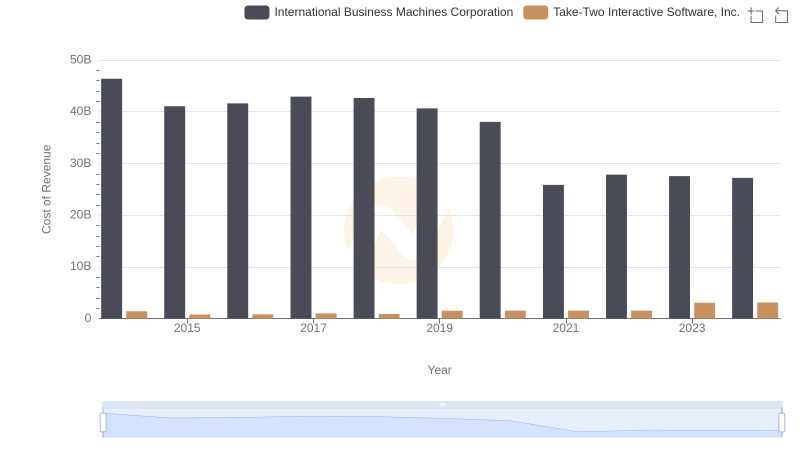
Cost of Revenue: Key Insights for International Business Machines Corporation and Take-Two Interactive Software, Inc.
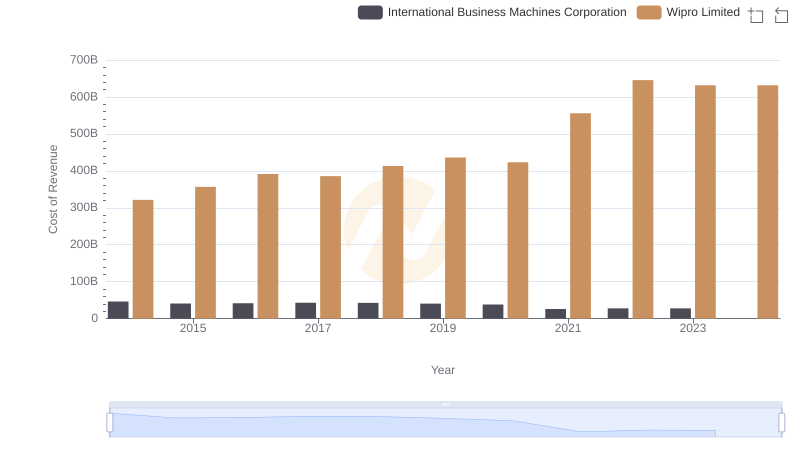
Analyzing Cost of Revenue: International Business Machines Corporation and Wipro Limited
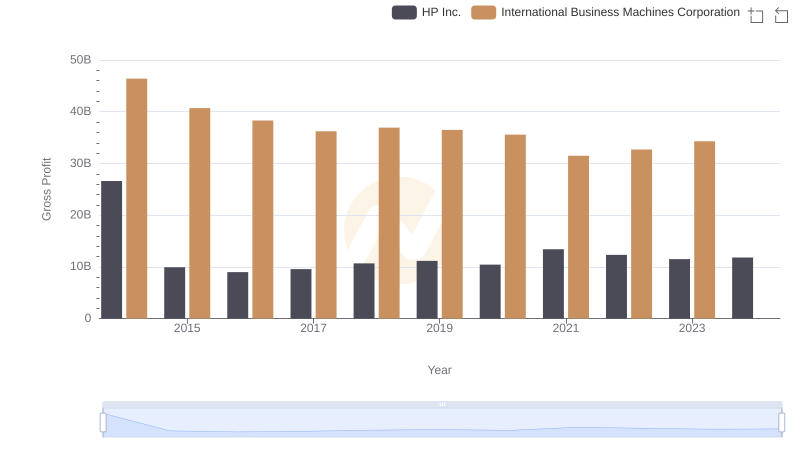
Key Insights on Gross Profit: International Business Machines Corporation vs HP Inc.

Comparing Cost of Revenue Efficiency: International Business Machines Corporation vs Microchip Technology Incorporated
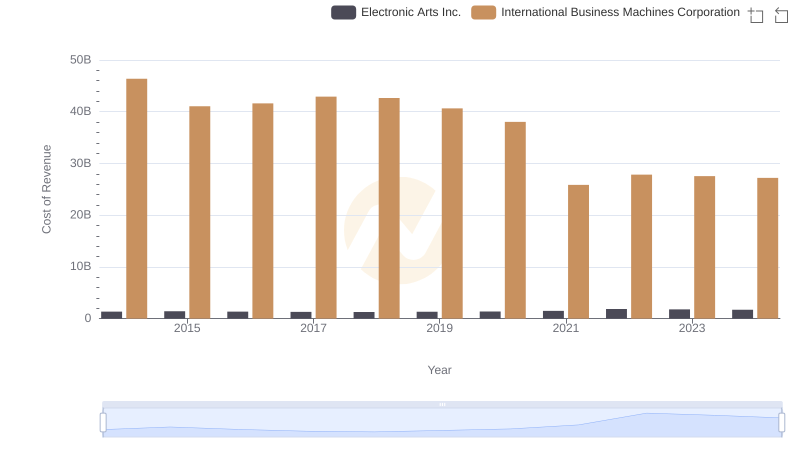
Comparing Cost of Revenue Efficiency: International Business Machines Corporation vs Electronic Arts Inc.
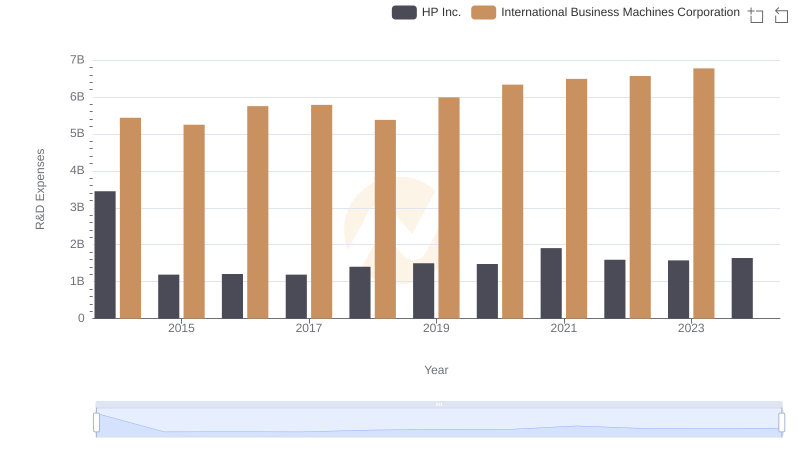
Analyzing R&D Budgets: International Business Machines Corporation vs HP Inc.
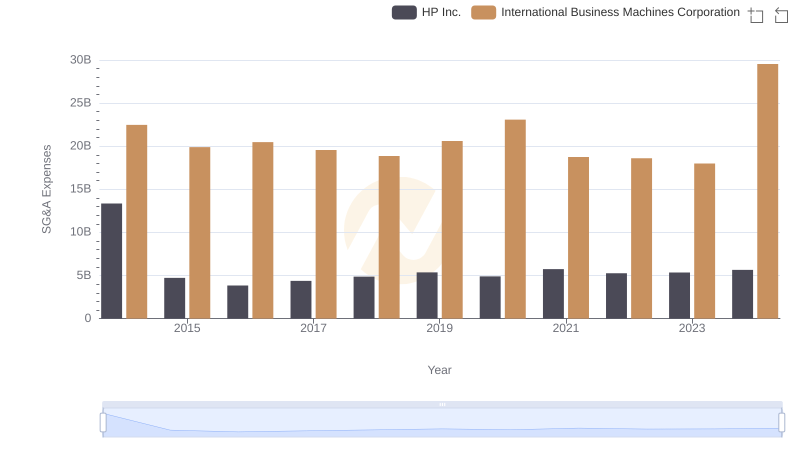
Breaking Down SG&A Expenses: International Business Machines Corporation vs HP Inc.
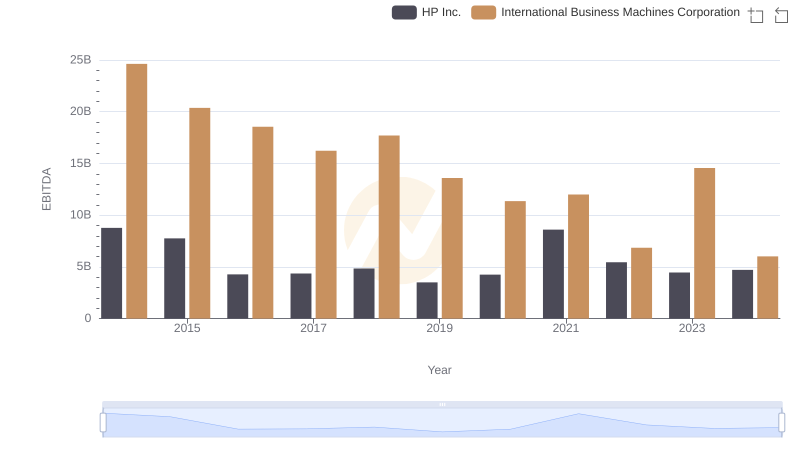
Professional EBITDA Benchmarking: International Business Machines Corporation vs HP Inc.