| __timestamp | Cisco Systems, Inc. | Gen Digital Inc. |
|---|---|---|
| Wednesday, January 1, 2014 | 27769000000 | 5527000000 |
| Thursday, January 1, 2015 | 29681000000 | 5355000000 |
| Friday, January 1, 2016 | 30960000000 | 2985000000 |
| Sunday, January 1, 2017 | 30224000000 | 3166000000 |
| Monday, January 1, 2018 | 30606000000 | 3814000000 |
| Tuesday, January 1, 2019 | 32666000000 | 3681000000 |
| Wednesday, January 1, 2020 | 31683000000 | 2097000000 |
| Friday, January 1, 2021 | 31894000000 | 2189000000 |
| Saturday, January 1, 2022 | 32248000000 | 2388000000 |
| Sunday, January 1, 2023 | 35753000000 | 2749000000 |
| Monday, January 1, 2024 | 34828000000 | 3081000000 |
Data in motion
In the ever-evolving landscape of technology, understanding financial trends is crucial. Over the past decade, Cisco Systems, Inc. has consistently demonstrated robust growth in gross profit, with a notable increase of approximately 29% from 2014 to 2023. This upward trajectory highlights Cisco's strategic prowess in maintaining its market dominance. In contrast, Gen Digital Inc. experienced a more volatile journey, with gross profits peaking in 2014 and then declining by nearly 50% by 2023. This divergence underscores the competitive challenges faced by smaller tech firms in a rapidly changing industry. As we look towards 2024, Cisco's gross profit remains strong, while Gen Digital shows signs of recovery. These trends offer valuable insights into the financial health and strategic direction of these tech giants, providing investors and analysts with a clearer picture of the industry's future.
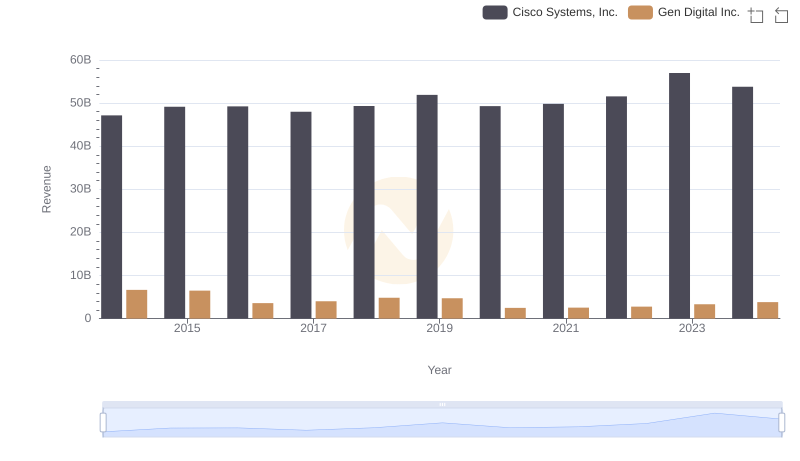
Breaking Down Revenue Trends: Cisco Systems, Inc. vs Gen Digital Inc.

Cisco Systems, Inc. and Manhattan Associates, Inc.: A Detailed Gross Profit Analysis

Gross Profit Comparison: Cisco Systems, Inc. and Teradyne, Inc. Trends
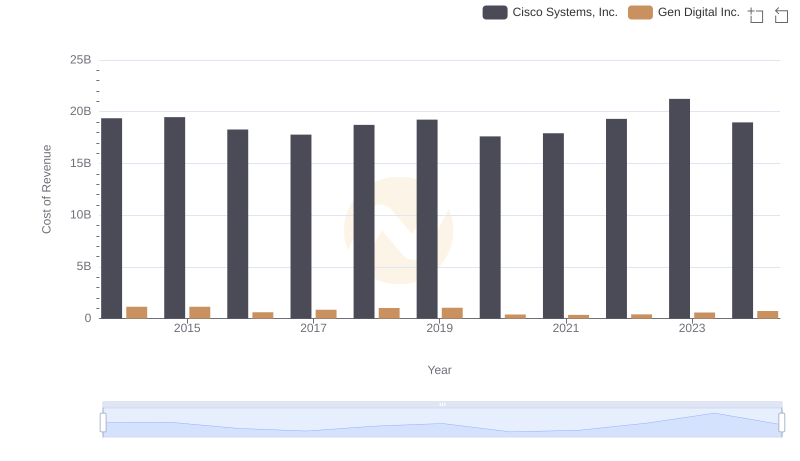
Comparing Cost of Revenue Efficiency: Cisco Systems, Inc. vs Gen Digital Inc.
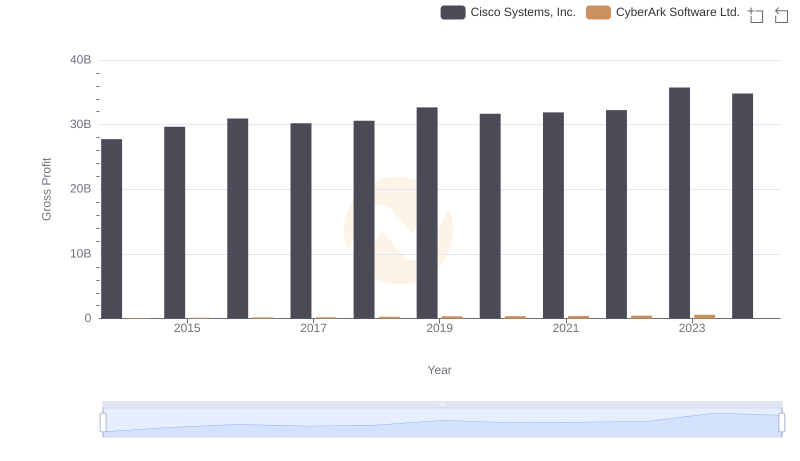
Gross Profit Analysis: Comparing Cisco Systems, Inc. and CyberArk Software Ltd.

Gross Profit Analysis: Comparing Cisco Systems, Inc. and Guidewire Software, Inc.

Cisco Systems, Inc. vs Super Micro Computer, Inc.: A Gross Profit Performance Breakdown

Cisco Systems, Inc. and Jabil Inc.: A Detailed Gross Profit Analysis

Who Generates Higher Gross Profit? Cisco Systems, Inc. or Nutanix, Inc.
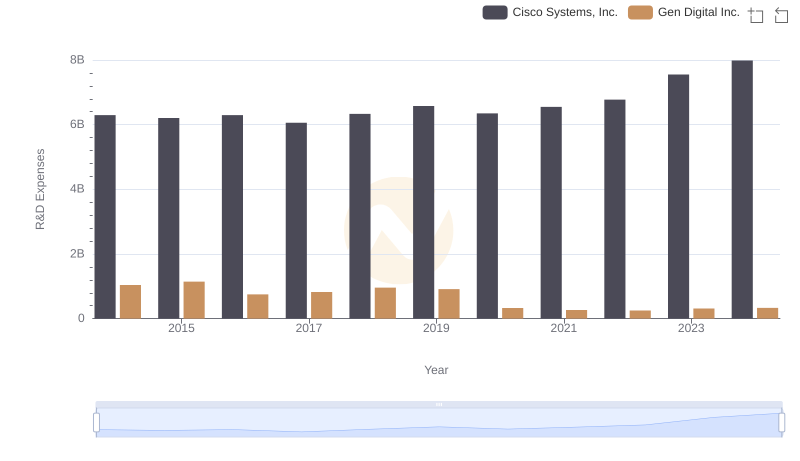
R&D Spending Showdown: Cisco Systems, Inc. vs Gen Digital Inc.
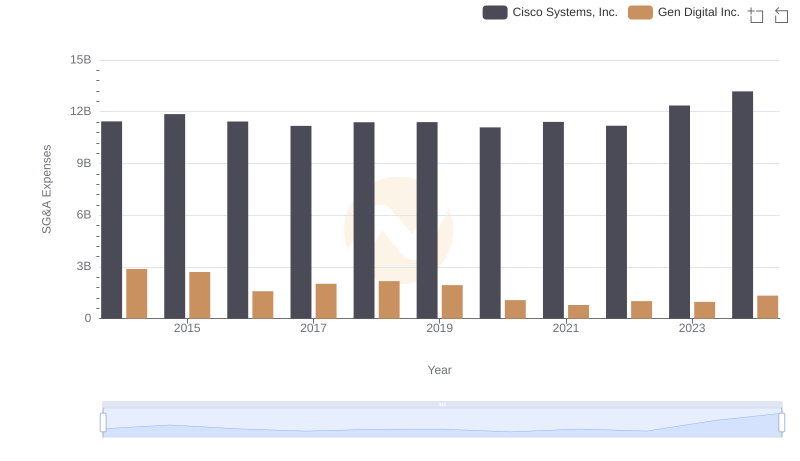
SG&A Efficiency Analysis: Comparing Cisco Systems, Inc. and Gen Digital Inc.

Professional EBITDA Benchmarking: Cisco Systems, Inc. vs Gen Digital Inc.