| __timestamp | Cisco Systems, Inc. | Gen Digital Inc. |
|---|---|---|
| Wednesday, January 1, 2014 | 11437000000 | 2880000000 |
| Thursday, January 1, 2015 | 11861000000 | 2702000000 |
| Friday, January 1, 2016 | 11433000000 | 1587000000 |
| Sunday, January 1, 2017 | 11177000000 | 2023000000 |
| Monday, January 1, 2018 | 11386000000 | 2171000000 |
| Tuesday, January 1, 2019 | 11398000000 | 1940000000 |
| Wednesday, January 1, 2020 | 11094000000 | 1069000000 |
| Friday, January 1, 2021 | 11411000000 | 791000000 |
| Saturday, January 1, 2022 | 11186000000 | 1014000000 |
| Sunday, January 1, 2023 | 12358000000 | 968000000 |
| Monday, January 1, 2024 | 13177000000 | 1337000000 |
Unleashing insights
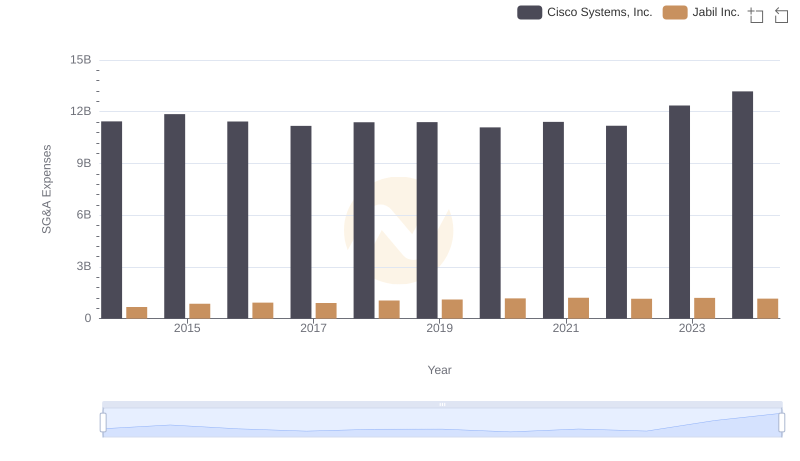
In the ever-evolving landscape of technology, understanding operational efficiency is crucial. Cisco Systems, Inc. and Gen Digital Inc. offer a fascinating study in contrasts over the past decade. From 2014 to 2024, Cisco's Selling, General, and Administrative (SG&A) expenses have shown a steady increase, peaking at approximately $13.2 billion in 2024, a 15% rise from 2014. In contrast, Gen Digital's SG&A expenses have fluctuated, with a notable decrease of over 50% from 2014 to 2023, before a slight uptick in 2024. This divergence highlights Cisco's consistent investment in operational infrastructure, while Gen Digital appears to be optimizing its cost structure. As we move forward, these trends may offer insights into each company's strategic priorities and market positioning. Understanding these dynamics is essential for investors and industry analysts alike, as they navigate the complexities of the tech sector.
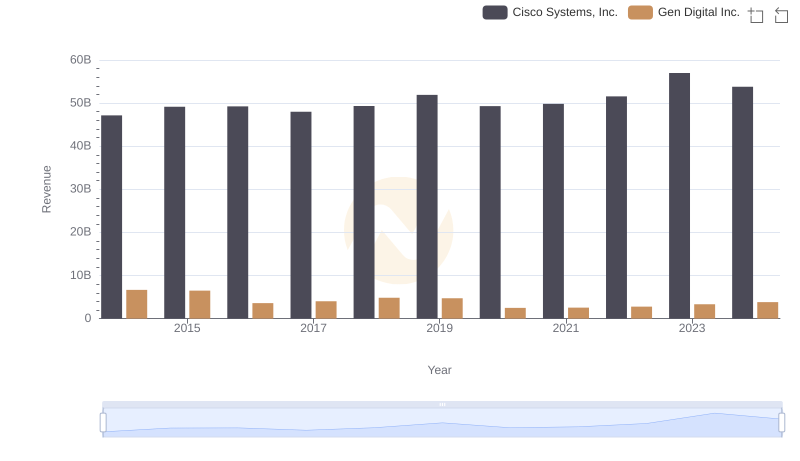
Breaking Down Revenue Trends: Cisco Systems, Inc. vs Gen Digital Inc.
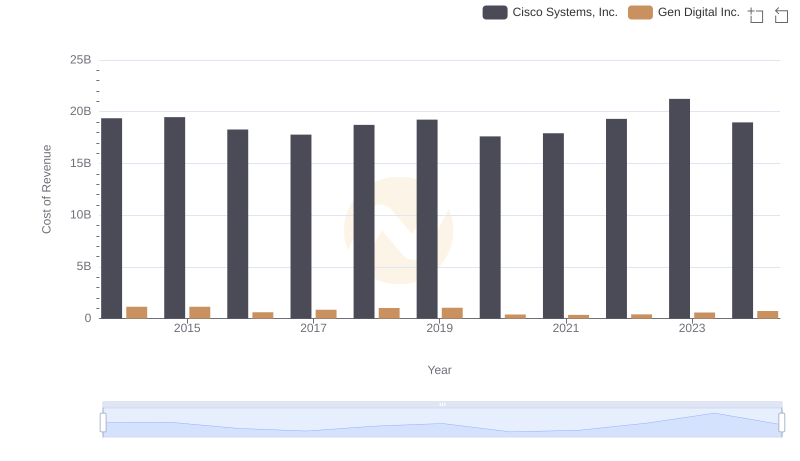
Comparing Cost of Revenue Efficiency: Cisco Systems, Inc. vs Gen Digital Inc.
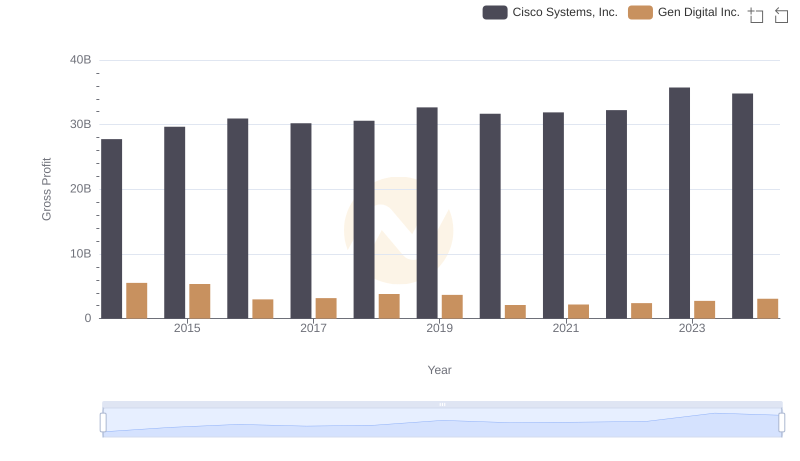
Gross Profit Trends Compared: Cisco Systems, Inc. vs Gen Digital Inc.
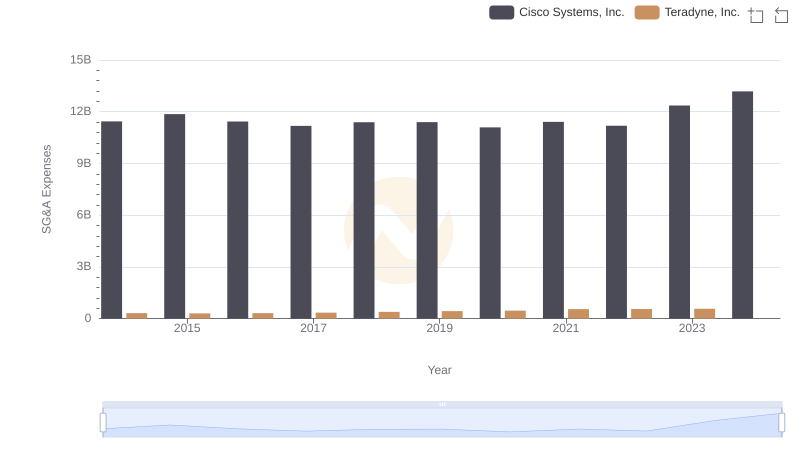
Cisco Systems, Inc. or Teradyne, Inc.: Who Manages SG&A Costs Better?
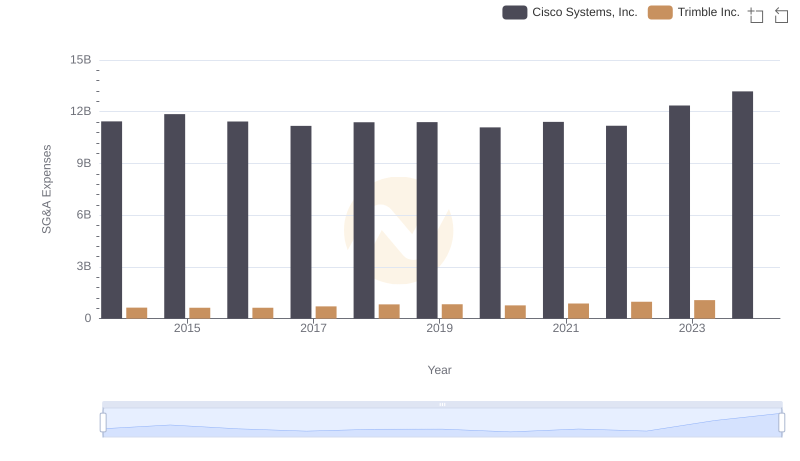
Cost Management Insights: SG&A Expenses for Cisco Systems, Inc. and Trimble Inc.
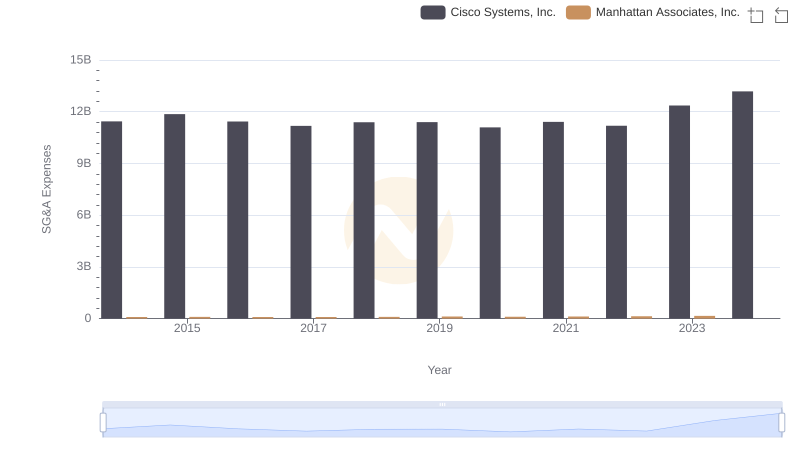
Who Optimizes SG&A Costs Better? Cisco Systems, Inc. or Manhattan Associates, Inc.

SG&A Efficiency Analysis: Comparing Cisco Systems, Inc. and CyberArk Software Ltd.
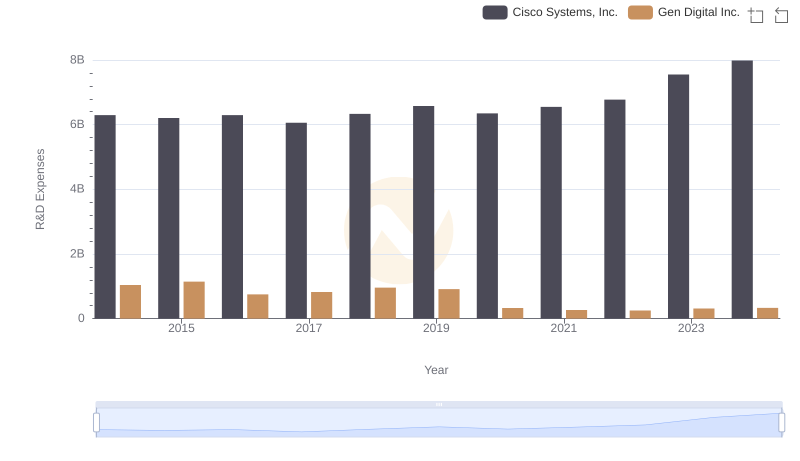
R&D Spending Showdown: Cisco Systems, Inc. vs Gen Digital Inc.
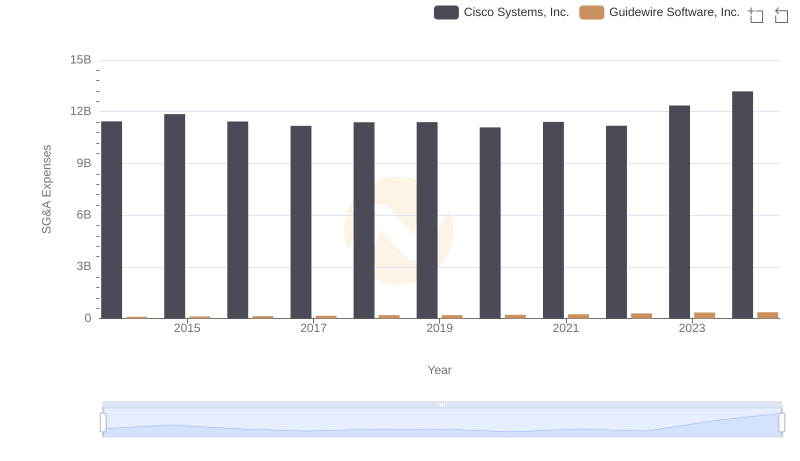
Cisco Systems, Inc. vs Guidewire Software, Inc.: SG&A Expense Trends
SG&A Efficiency Analysis: Comparing Cisco Systems, Inc. and Jabil Inc.

Professional EBITDA Benchmarking: Cisco Systems, Inc. vs Gen Digital Inc.

Cisco Systems, Inc. and Super Micro Computer, Inc.: SG&A Spending Patterns Compared