| __timestamp | Cisco Systems, Inc. | Gen Digital Inc. |
|---|---|---|
| Wednesday, January 1, 2014 | 12709000000 | 1731000000 |
| Thursday, January 1, 2015 | 14209000000 | 530000000 |
| Friday, January 1, 2016 | 15678000000 | 766000000 |
| Sunday, January 1, 2017 | 15383000000 | 476000000 |
| Monday, January 1, 2018 | 16172000000 | 1333000000 |
| Tuesday, January 1, 2019 | 17334000000 | 350000000 |
| Wednesday, January 1, 2020 | 16363000000 | 1286000000 |
| Friday, January 1, 2021 | 15558000000 | 1188000000 |
| Saturday, January 1, 2022 | 16794000000 | 1328000000 |
| Sunday, January 1, 2023 | 17471000000 | 1557000000 |
| Monday, January 1, 2024 | 15747000000 | 1629000000 |
Cracking the code
In the ever-evolving tech industry, understanding financial health is crucial. Cisco Systems, Inc. and Gen Digital Inc. have been pivotal players, each with unique trajectories. From 2014 to 2023, Cisco consistently outperformed Gen Digital in EBITDA, a key profitability metric. Cisco's EBITDA grew by approximately 37% over this period, peaking in 2023, while Gen Digital's figures fluctuated, with a notable dip in 2019. Despite this, Gen Digital showed resilience, achieving a 345% increase from its 2015 low to 2023. This comparison highlights Cisco's steady growth and Gen Digital's volatility, offering insights into their strategic financial management. As we look to 2024, both companies face the challenge of maintaining momentum in a competitive landscape. This analysis underscores the importance of strategic planning and adaptability in sustaining financial success.
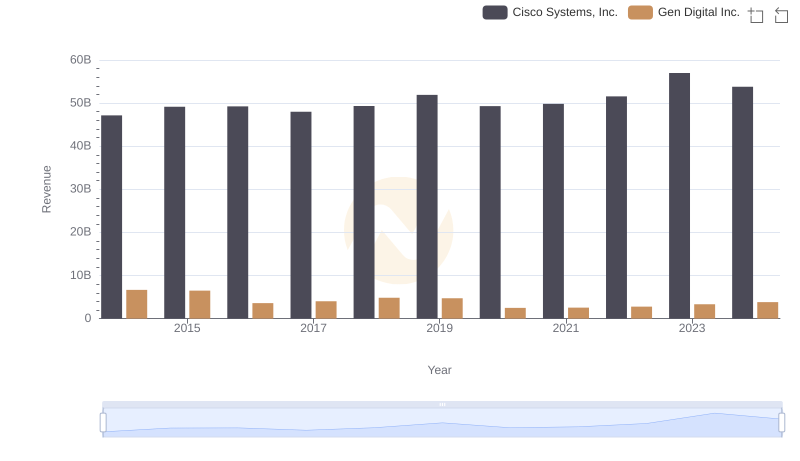
Breaking Down Revenue Trends: Cisco Systems, Inc. vs Gen Digital Inc.
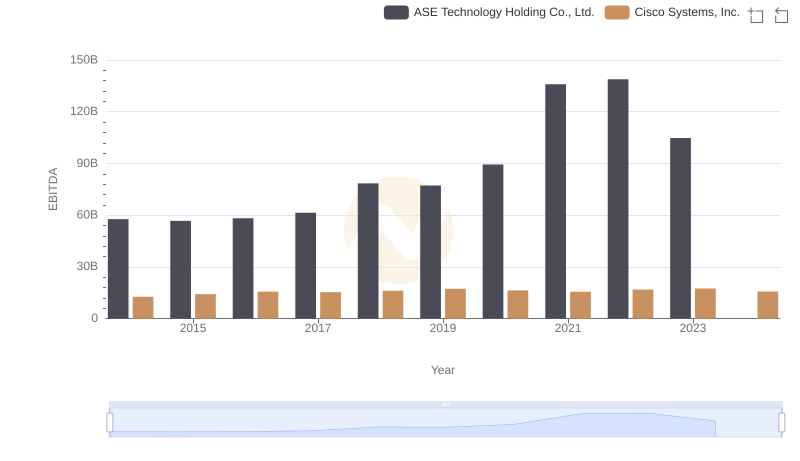
EBITDA Analysis: Evaluating Cisco Systems, Inc. Against ASE Technology Holding Co., Ltd.
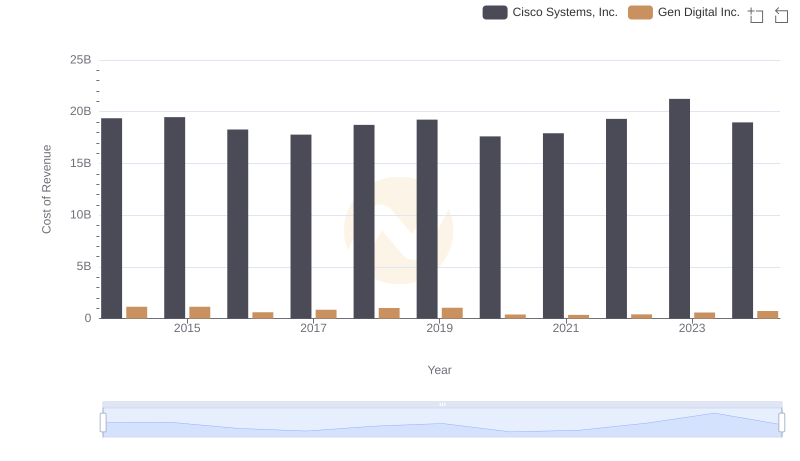
Comparing Cost of Revenue Efficiency: Cisco Systems, Inc. vs Gen Digital Inc.
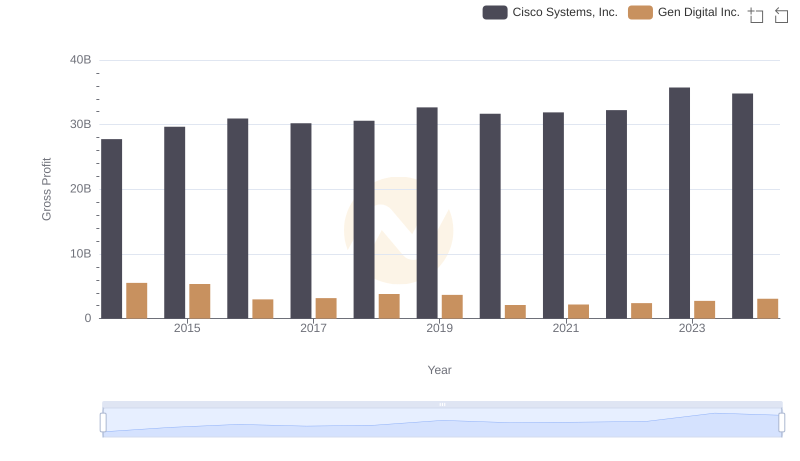
Gross Profit Trends Compared: Cisco Systems, Inc. vs Gen Digital Inc.
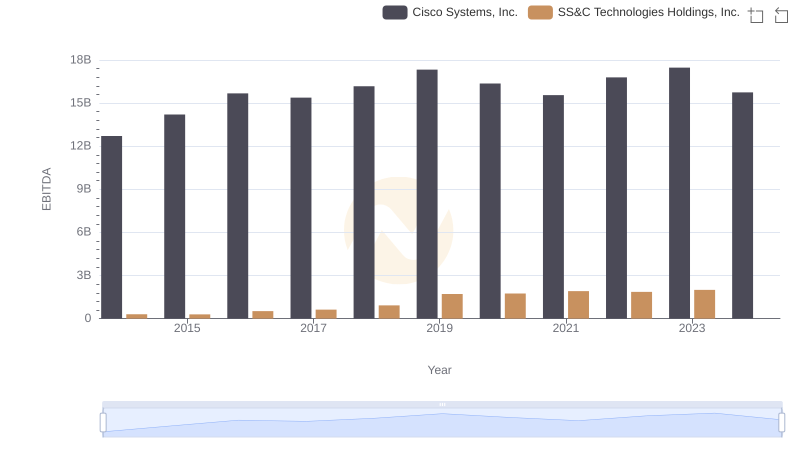
Cisco Systems, Inc. vs SS&C Technologies Holdings, Inc.: In-Depth EBITDA Performance Comparison
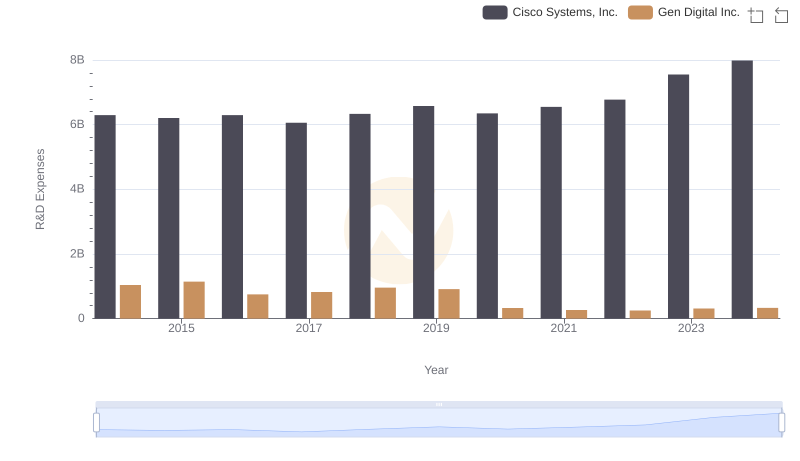
R&D Spending Showdown: Cisco Systems, Inc. vs Gen Digital Inc.
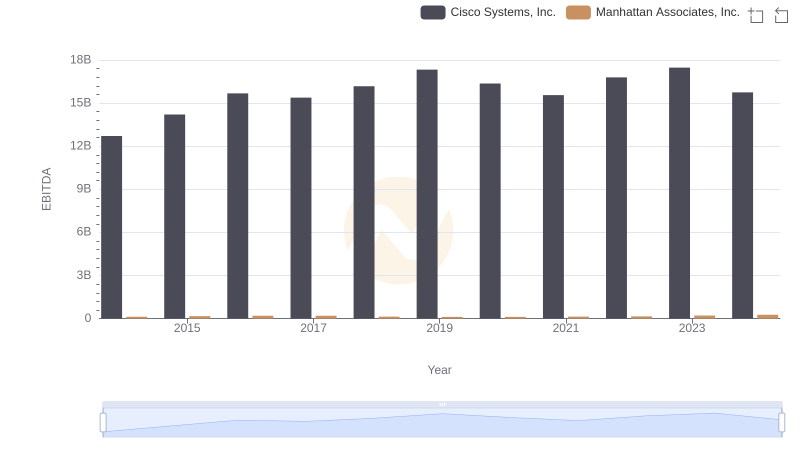
Cisco Systems, Inc. vs Manhattan Associates, Inc.: In-Depth EBITDA Performance Comparison
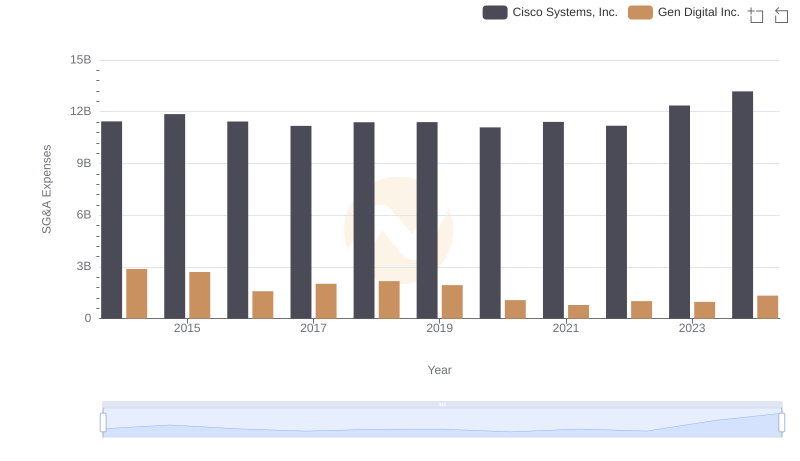
SG&A Efficiency Analysis: Comparing Cisco Systems, Inc. and Gen Digital Inc.
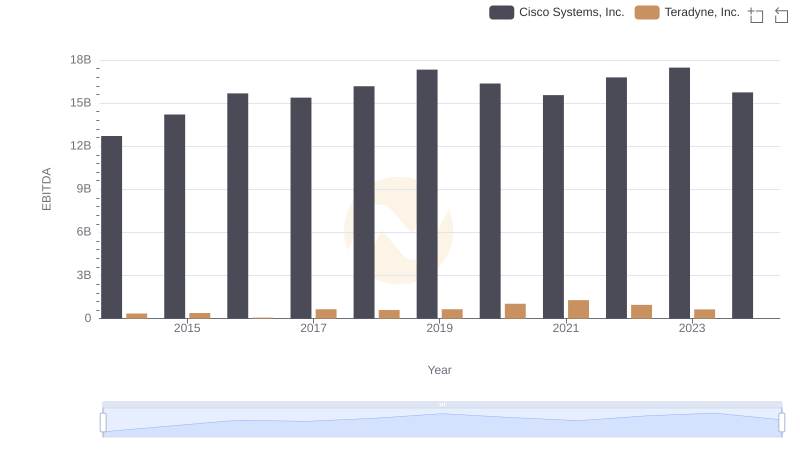
A Side-by-Side Analysis of EBITDA: Cisco Systems, Inc. and Teradyne, Inc.
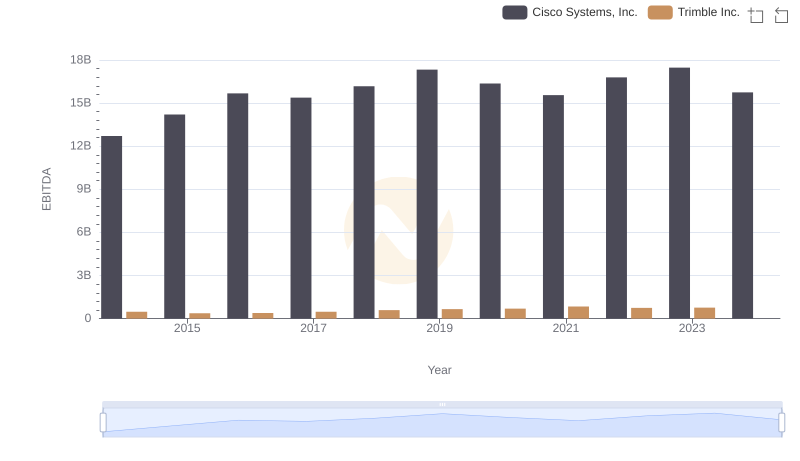
Comparative EBITDA Analysis: Cisco Systems, Inc. vs Trimble Inc.
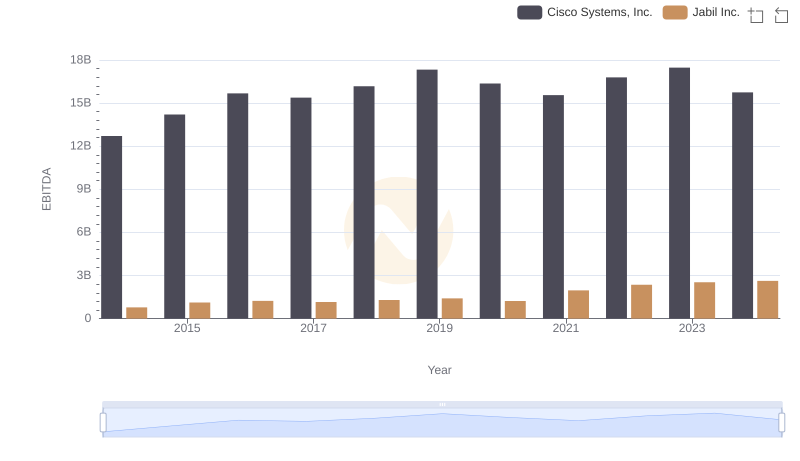
Professional EBITDA Benchmarking: Cisco Systems, Inc. vs Jabil Inc.
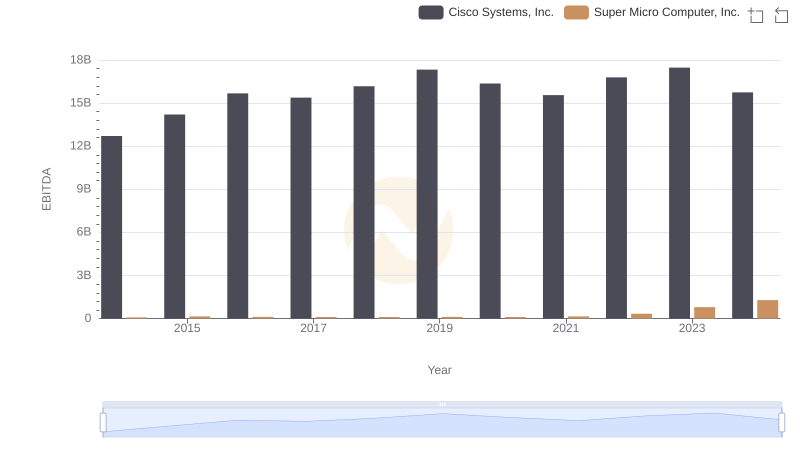
EBITDA Performance Review: Cisco Systems, Inc. vs Super Micro Computer, Inc.