| __timestamp | Allegion plc | Waste Connections, Inc. |
|---|---|---|
| Wednesday, January 1, 2014 | 365700000 | 717805000 |
| Thursday, January 1, 2015 | 315400000 | 191002871 |
| Friday, January 1, 2016 | 422600000 | 900371894 |
| Sunday, January 1, 2017 | 523300000 | 1380632000 |
| Monday, January 1, 2018 | 617600000 | 1442229014 |
| Tuesday, January 1, 2019 | 614300000 | 1650754605 |
| Wednesday, January 1, 2020 | 497700000 | 1597555000 |
| Friday, January 1, 2021 | 657300000 | 1891001000 |
| Saturday, January 1, 2022 | 688300000 | 2090554149 |
| Sunday, January 1, 2023 | 819300000 | 2261354000 |
| Monday, January 1, 2024 | 919800000 | 2389779000 |
Data in motion
In the ever-evolving landscape of corporate finance, EBITDA serves as a crucial indicator of a company's operational performance. Over the past decade, Waste Connections, Inc. and Allegion plc have demonstrated contrasting trajectories in their EBITDA growth. From 2014 to 2023, Waste Connections, Inc. has seen a remarkable increase of over 215%, reaching its peak in 2023. In contrast, Allegion plc experienced a steady growth of approximately 124% during the same period.
Waste Connections, Inc.'s robust growth can be attributed to strategic acquisitions and an expanding market presence, while Allegion plc's consistent performance highlights its resilience in the security products sector. This side-by-side analysis not only underscores the dynamic nature of these industries but also offers valuable insights for investors seeking to understand the financial health and potential of these companies.
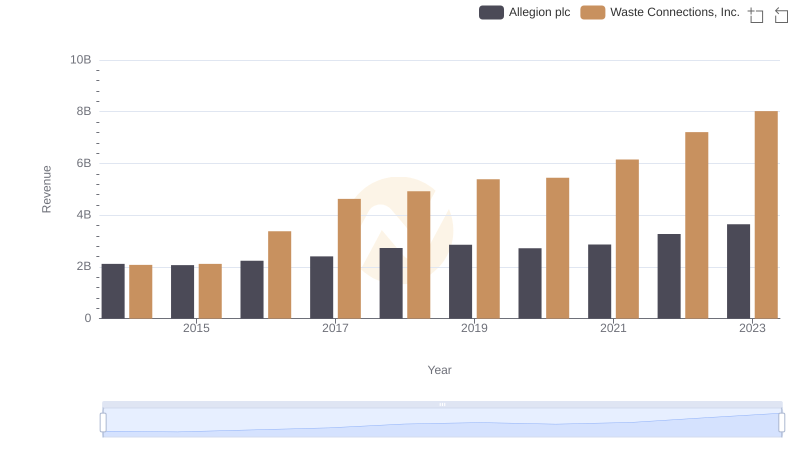
Revenue Showdown: Waste Connections, Inc. vs Allegion plc
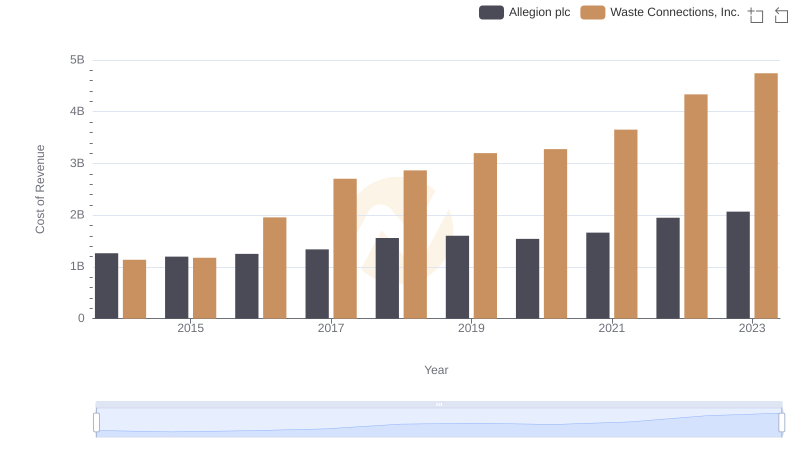
Comparing Cost of Revenue Efficiency: Waste Connections, Inc. vs Allegion plc
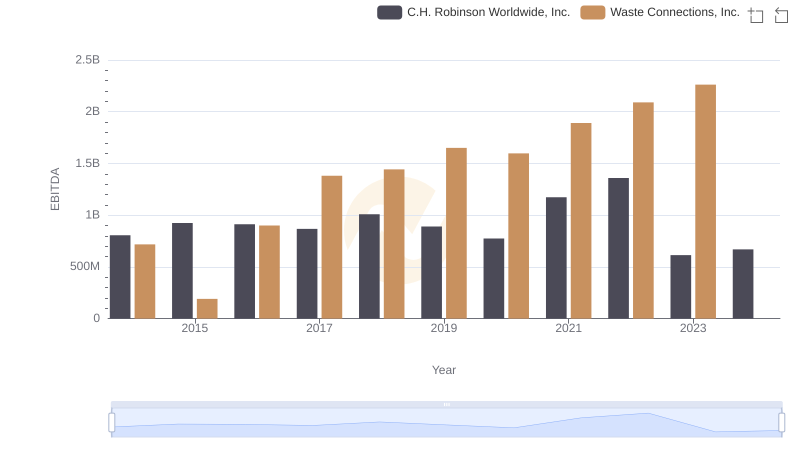
A Professional Review of EBITDA: Waste Connections, Inc. Compared to C.H. Robinson Worldwide, Inc.
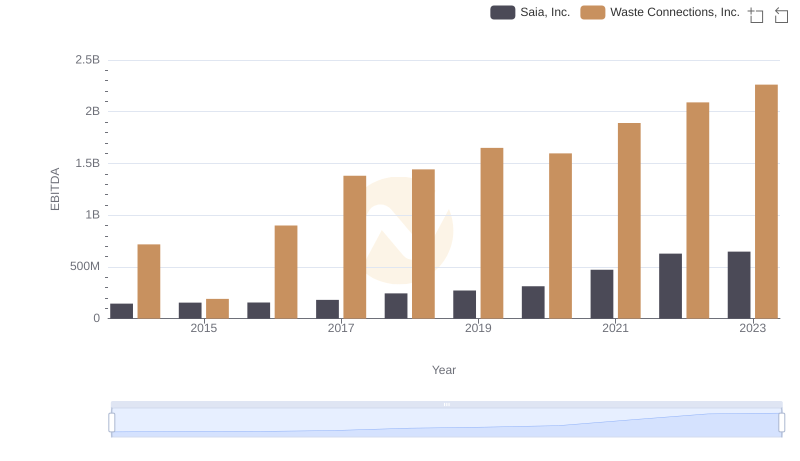
EBITDA Performance Review: Waste Connections, Inc. vs Saia, Inc.

Comprehensive EBITDA Comparison: Waste Connections, Inc. vs Nordson Corporation
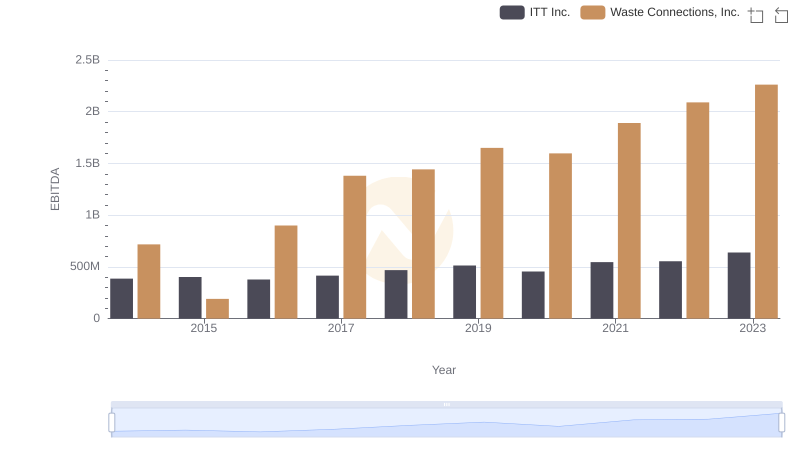
Comprehensive EBITDA Comparison: Waste Connections, Inc. vs ITT Inc.
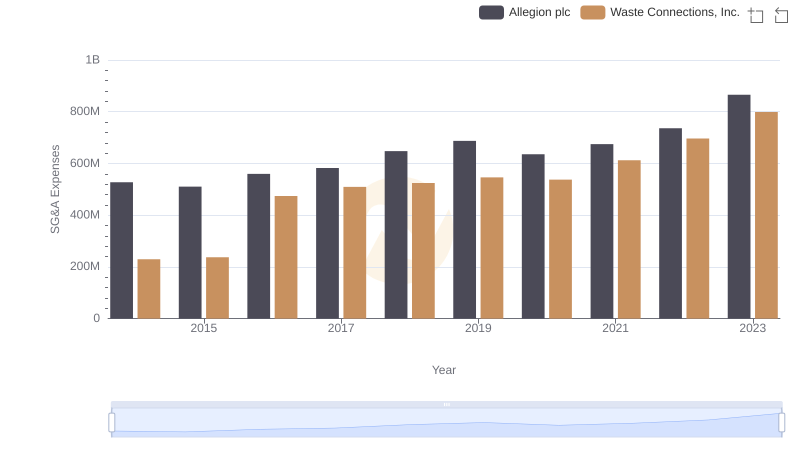
Waste Connections, Inc. or Allegion plc: Who Manages SG&A Costs Better?

Comparative EBITDA Analysis: Waste Connections, Inc. vs Rentokil Initial plc