| __timestamp | Rentokil Initial plc | United Rentals, Inc. |
|---|---|---|
| Wednesday, January 1, 2014 | 297500000 | 3253000000 |
| Thursday, January 1, 2015 | 310200000 | 3337000000 |
| Friday, January 1, 2016 | 376100000 | 3359000000 |
| Sunday, January 1, 2017 | 474900000 | 3872000000 |
| Monday, January 1, 2018 | 514200000 | 4683000000 |
| Tuesday, January 1, 2019 | 2099000000 | 5681000000 |
| Wednesday, January 1, 2020 | 2136400000 | 5347000000 |
| Friday, January 1, 2021 | 2239100000 | 5863000000 |
| Saturday, January 1, 2022 | 2737000000 | 6646000000 |
| Sunday, January 1, 2023 | 927000000 | 8519000000 |
| Monday, January 1, 2024 | 9195000000 |
Data in motion
In the ever-evolving landscape of the rental industry, understanding cost dynamics is crucial. United Rentals, Inc. and Rentokil Initial plc, two giants in their respective fields, offer a fascinating study in contrasts. From 2014 to 2023, United Rentals consistently reported higher costs of revenue, peaking at approximately $8.5 billion in 2023, a staggering 162% increase from 2014. In contrast, Rentokil Initial plc's cost of revenue saw a more modest rise, reaching around $927 million in 2023, marking a 212% increase from its 2014 figures.
This disparity highlights United Rentals' aggressive expansion and market dominance, while Rentokil's steady growth reflects its strategic focus on efficiency. Notably, 2024 data for Rentokil is missing, suggesting potential shifts or reporting delays. As the industry adapts to new challenges, these insights provide a window into the strategic priorities of these key players.
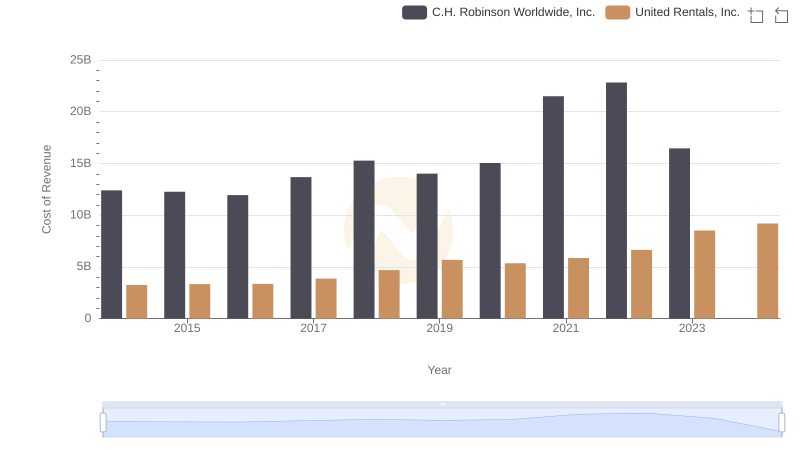
United Rentals, Inc. vs C.H. Robinson Worldwide, Inc.: Efficiency in Cost of Revenue Explored
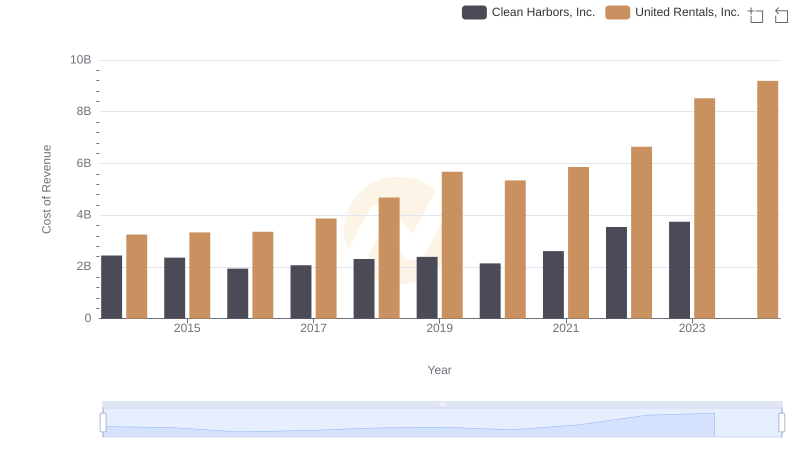
Cost of Revenue: Key Insights for United Rentals, Inc. and Clean Harbors, Inc.
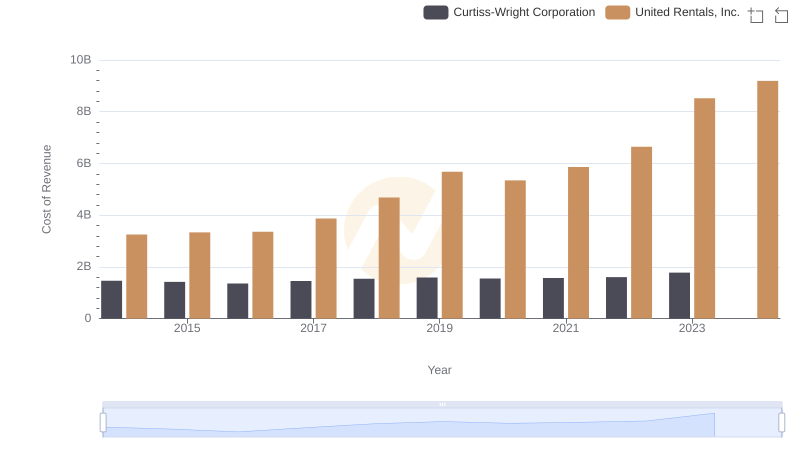
Cost of Revenue Trends: United Rentals, Inc. vs Curtiss-Wright Corporation
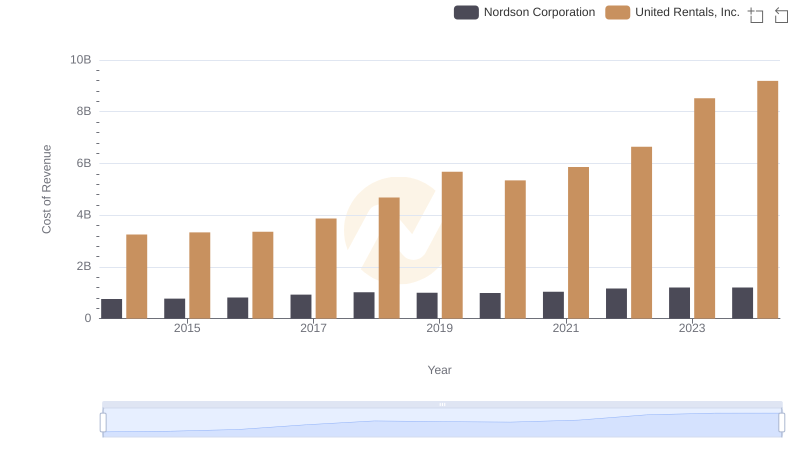
Comparing Cost of Revenue Efficiency: United Rentals, Inc. vs Nordson Corporation
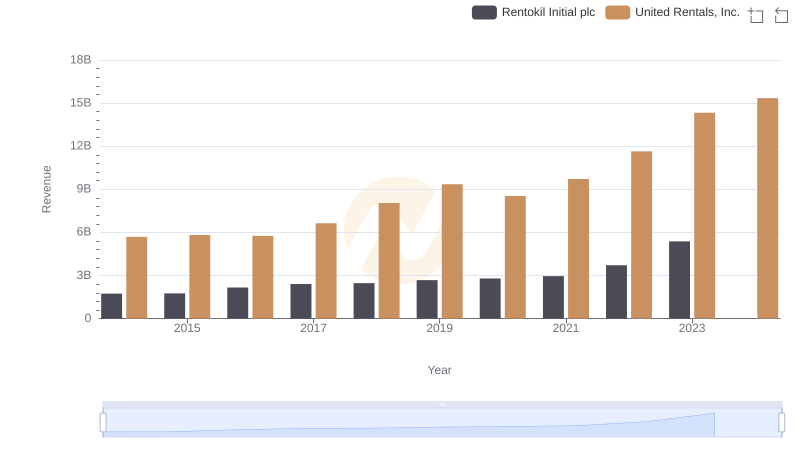
Revenue Showdown: United Rentals, Inc. vs Rentokil Initial plc
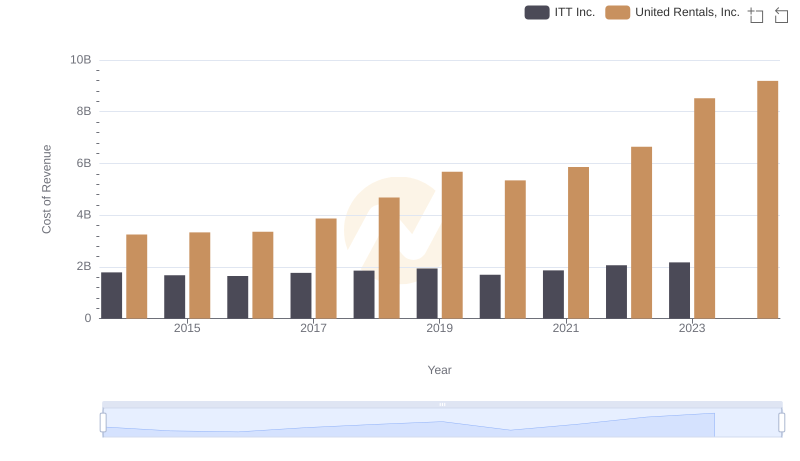
Cost of Revenue Comparison: United Rentals, Inc. vs ITT Inc.
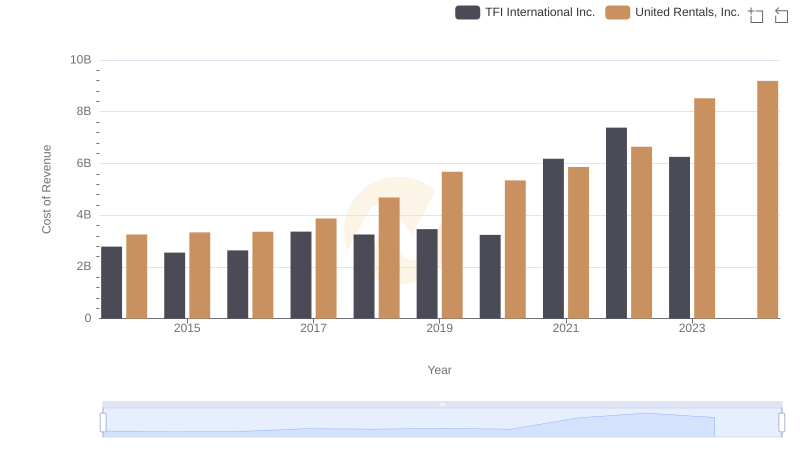
Cost Insights: Breaking Down United Rentals, Inc. and TFI International Inc.'s Expenses
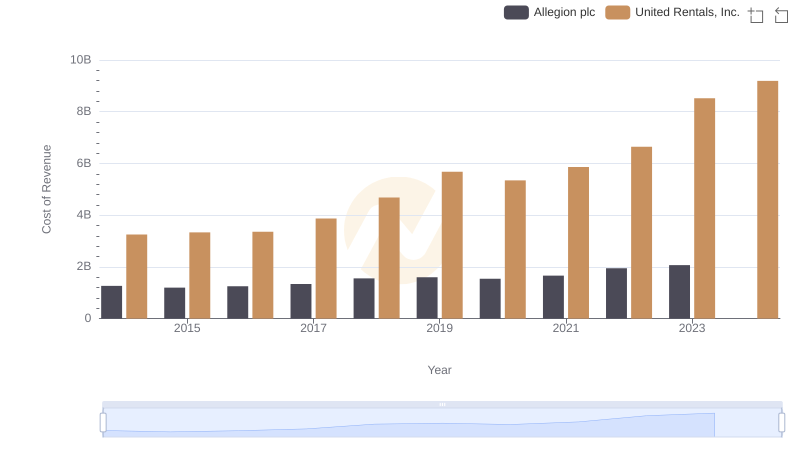
Cost of Revenue: Key Insights for United Rentals, Inc. and Allegion plc
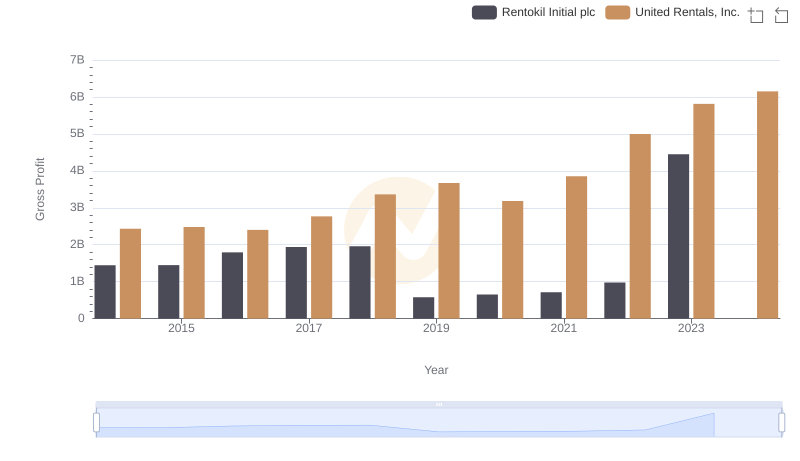
Who Generates Higher Gross Profit? United Rentals, Inc. or Rentokil Initial plc
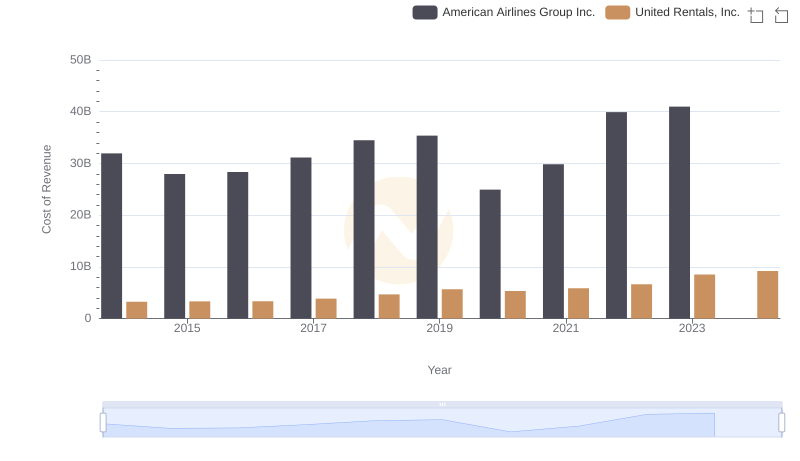
Cost of Revenue Trends: United Rentals, Inc. vs American Airlines Group Inc.
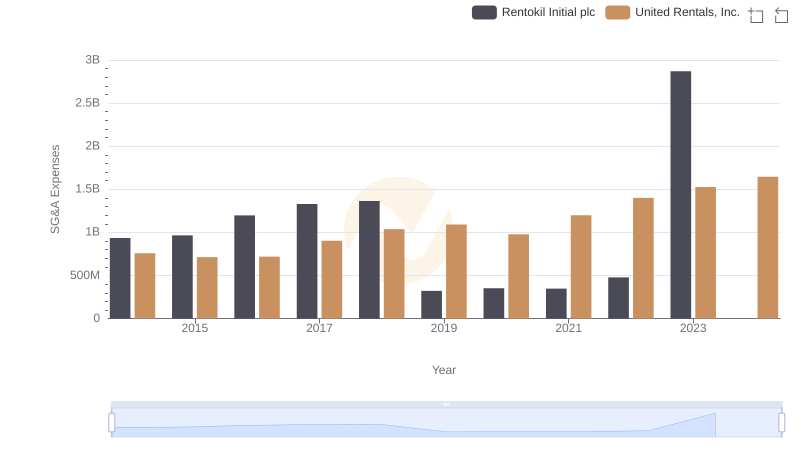
United Rentals, Inc. or Rentokil Initial plc: Who Manages SG&A Costs Better?
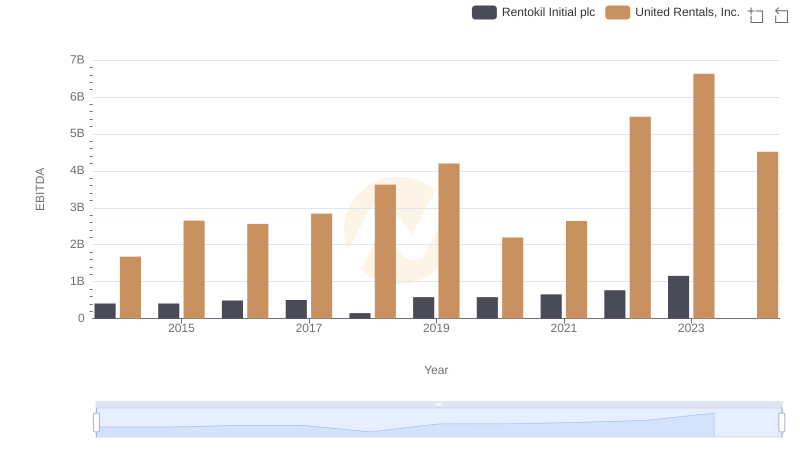
Comparative EBITDA Analysis: United Rentals, Inc. vs Rentokil Initial plc