| __timestamp | Rentokil Initial plc | United Rentals, Inc. |
|---|---|---|
| Wednesday, January 1, 2014 | 1740800000 | 5685000000 |
| Thursday, January 1, 2015 | 1759000000 | 5817000000 |
| Friday, January 1, 2016 | 2168100000 | 5762000000 |
| Sunday, January 1, 2017 | 2412300000 | 6641000000 |
| Monday, January 1, 2018 | 2472300000 | 8047000000 |
| Tuesday, January 1, 2019 | 2676200000 | 9351000000 |
| Wednesday, January 1, 2020 | 2789400000 | 8530000000 |
| Friday, January 1, 2021 | 2953900000 | 9716000000 |
| Saturday, January 1, 2022 | 3714000000 | 11642000000 |
| Sunday, January 1, 2023 | 5375000000 | 14332000000 |
| Monday, January 1, 2024 | 15345000000 |
Unleashing insights
In the competitive landscape of equipment rental and services, United Rentals, Inc. and Rentokil Initial plc have been key players. Over the past decade, United Rentals has consistently outperformed Rentokil Initial in terms of revenue. Starting in 2014, United Rentals generated approximately 3.3 times more revenue than Rentokil Initial. By 2023, this gap widened, with United Rentals achieving a revenue of $14.3 billion, nearly 2.7 times that of Rentokil Initial's $5.4 billion.
United Rentals has shown a robust growth trajectory, with a 152% increase in revenue from 2014 to 2023. In contrast, Rentokil Initial's revenue grew by 209% over the same period, indicating a strong upward trend despite being the smaller player. The data for 2024 is incomplete, but United Rentals is projected to continue its upward momentum. This analysis highlights the dynamic nature of the industry and the strategic maneuvers of these two giants.
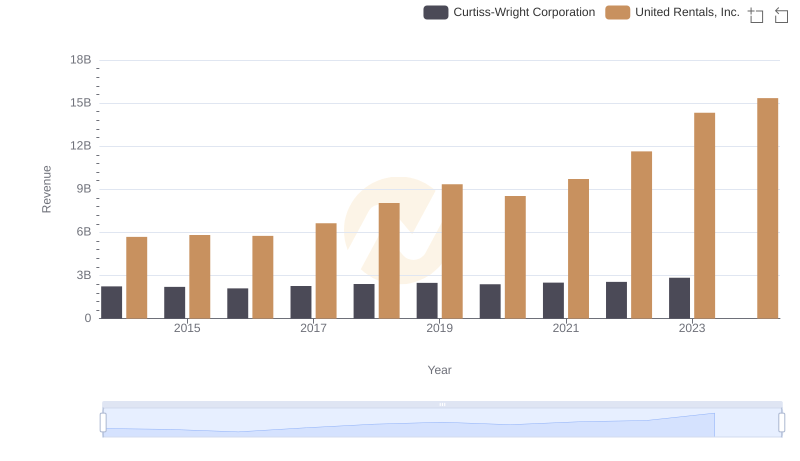
Who Generates More Revenue? United Rentals, Inc. or Curtiss-Wright Corporation
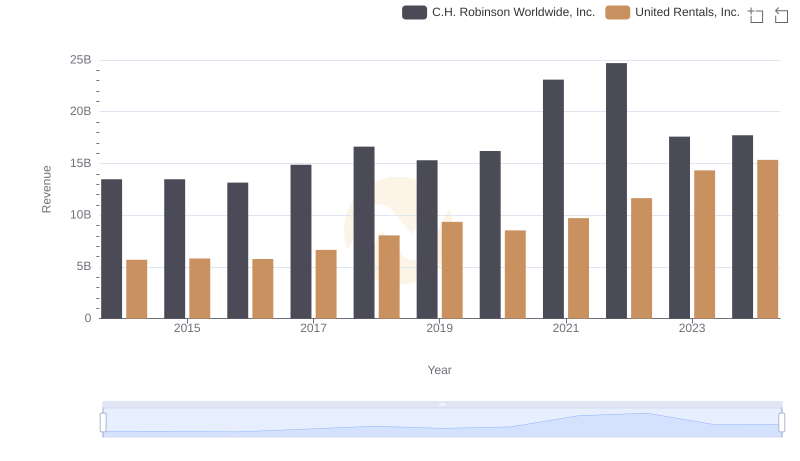
United Rentals, Inc. vs C.H. Robinson Worldwide, Inc.: Examining Key Revenue Metrics
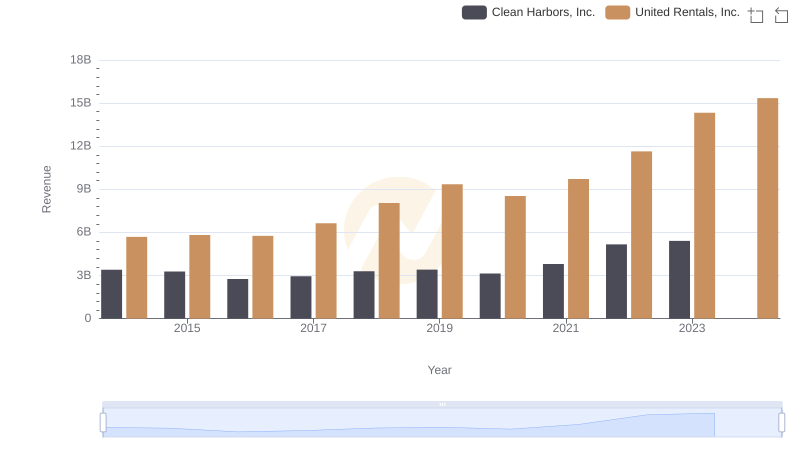
Breaking Down Revenue Trends: United Rentals, Inc. vs Clean Harbors, Inc.
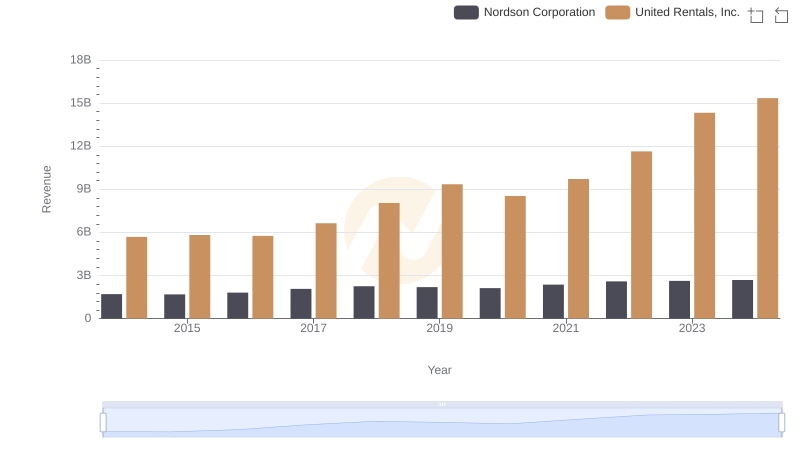
Revenue Showdown: United Rentals, Inc. vs Nordson Corporation
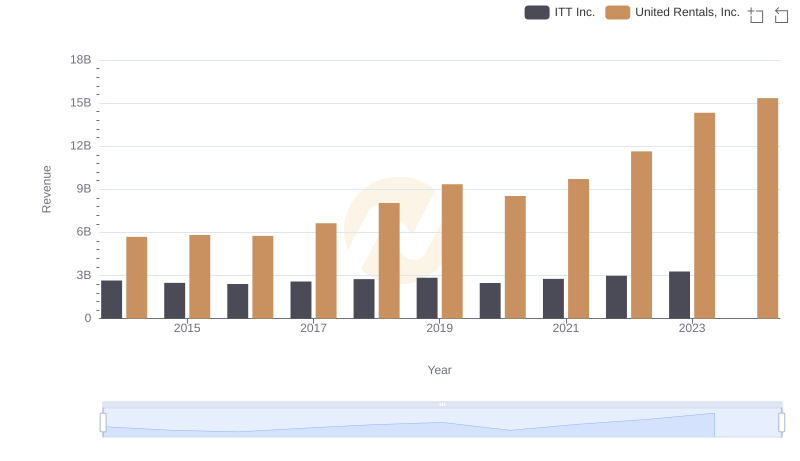
United Rentals, Inc. vs ITT Inc.: Annual Revenue Growth Compared
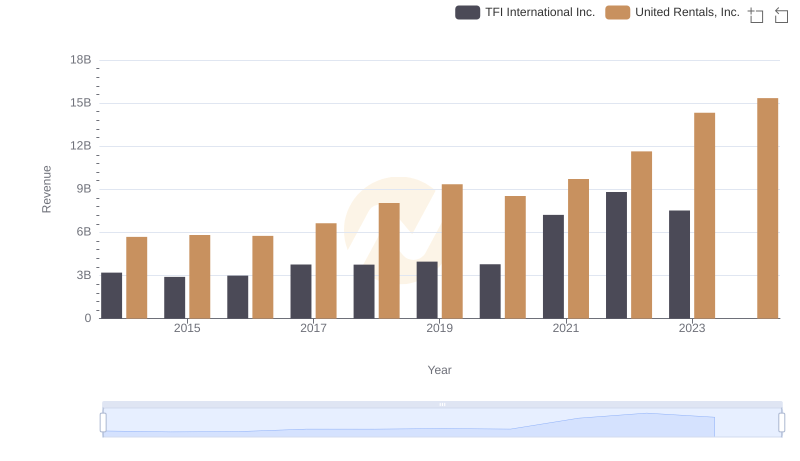
Who Generates More Revenue? United Rentals, Inc. or TFI International Inc.

United Rentals, Inc. vs Allegion plc: Examining Key Revenue Metrics
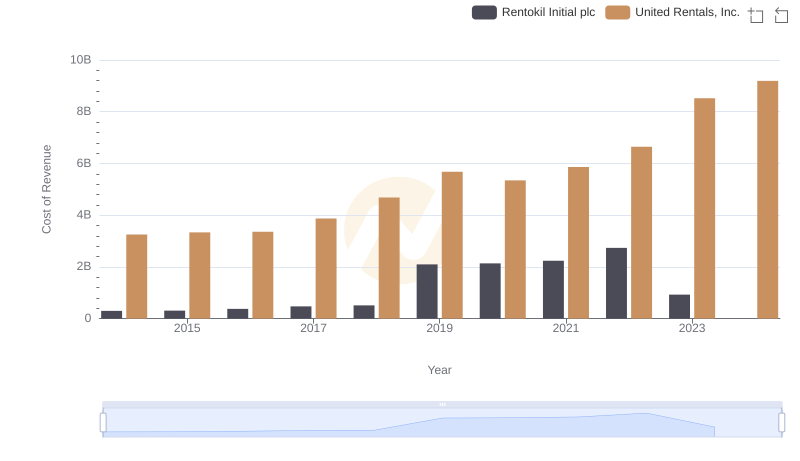
Cost of Revenue: Key Insights for United Rentals, Inc. and Rentokil Initial plc
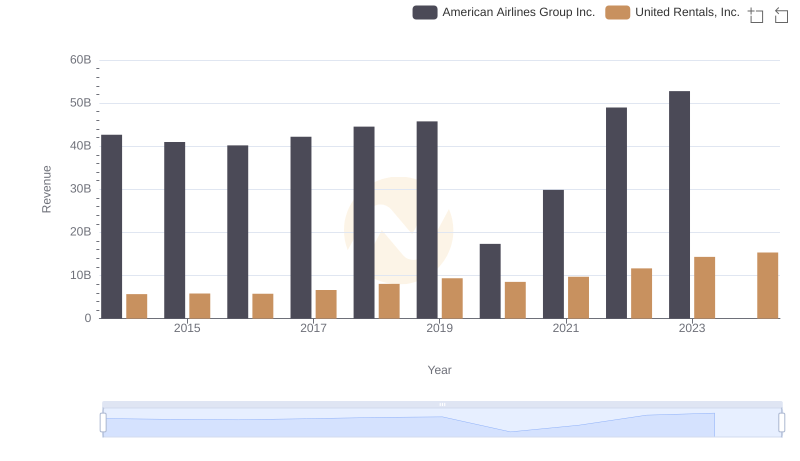
Breaking Down Revenue Trends: United Rentals, Inc. vs American Airlines Group Inc.
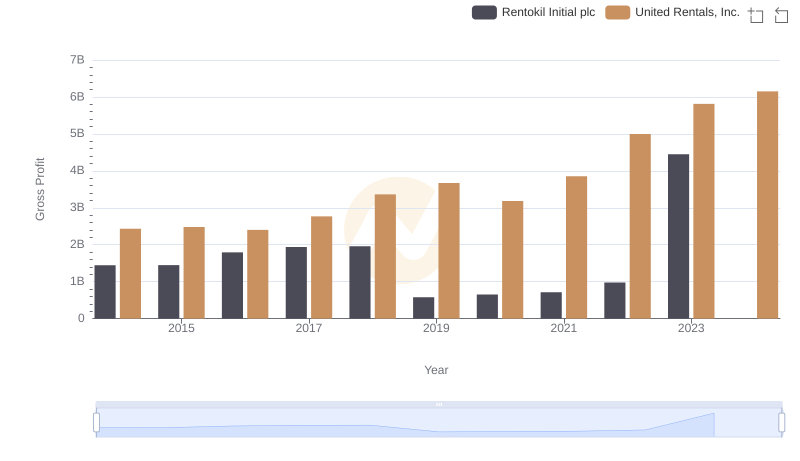
Who Generates Higher Gross Profit? United Rentals, Inc. or Rentokil Initial plc
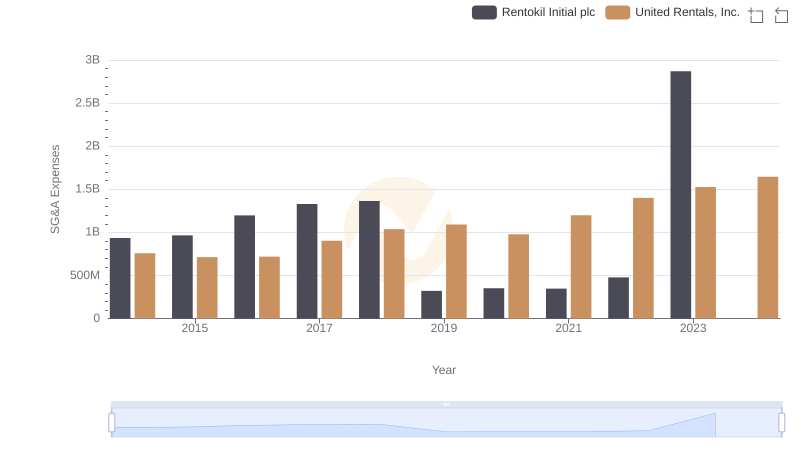
United Rentals, Inc. or Rentokil Initial plc: Who Manages SG&A Costs Better?
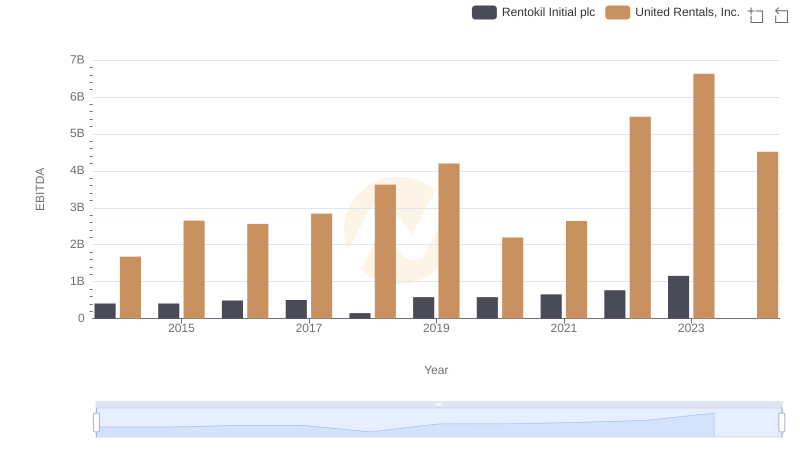
Comparative EBITDA Analysis: United Rentals, Inc. vs Rentokil Initial plc