| __timestamp | Illinois Tool Works Inc. | Trane Technologies plc |
|---|---|---|
| Wednesday, January 1, 2014 | 3453000000 | 1757000000 |
| Thursday, January 1, 2015 | 3420000000 | 1835000000 |
| Friday, January 1, 2016 | 3534000000 | 2311000000 |
| Sunday, January 1, 2017 | 3861000000 | 1982500000 |
| Monday, January 1, 2018 | 4065000000 | 2242400000 |
| Tuesday, January 1, 2019 | 3852000000 | 1931200000 |
| Wednesday, January 1, 2020 | 3322000000 | 1831900000 |
| Friday, January 1, 2021 | 3910000000 | 2319200000 |
| Saturday, January 1, 2022 | 4241000000 | 2715500000 |
| Sunday, January 1, 2023 | 4484000000 | 3149900000 |
| Monday, January 1, 2024 | 4264000000 | 3859600000 |
Data in motion
In the competitive landscape of industrial manufacturing, Trane Technologies plc and Illinois Tool Works Inc. have demonstrated remarkable EBITDA growth over the past decade. From 2014 to 2023, Illinois Tool Works Inc. saw its EBITDA rise by approximately 30%, peaking at $4.48 billion in 2023. Meanwhile, Trane Technologies plc experienced an impressive 79% increase, reaching $3.15 billion in the same year.
This analysis highlights the dynamic shifts and strategic maneuvers within the industrial sector, offering valuable insights for investors and industry enthusiasts alike.
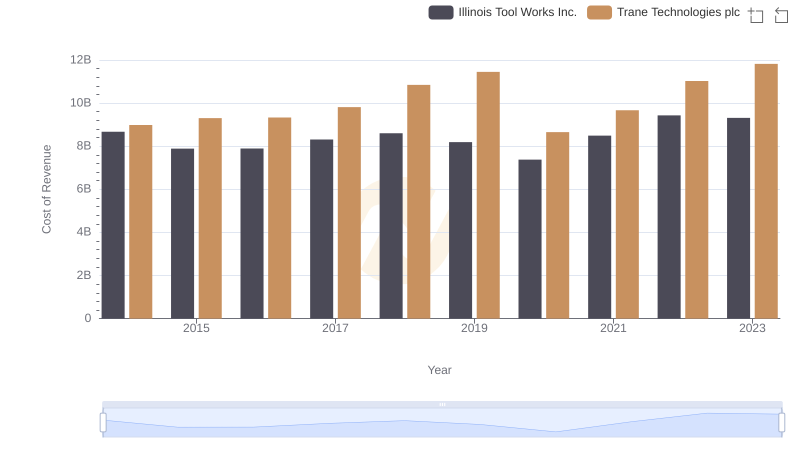
Trane Technologies plc vs Illinois Tool Works Inc.: Efficiency in Cost of Revenue Explored
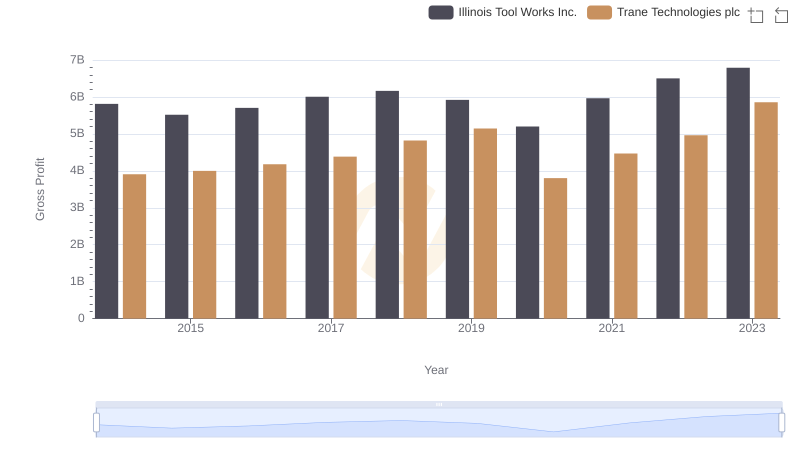
Trane Technologies plc and Illinois Tool Works Inc.: A Detailed Gross Profit Analysis
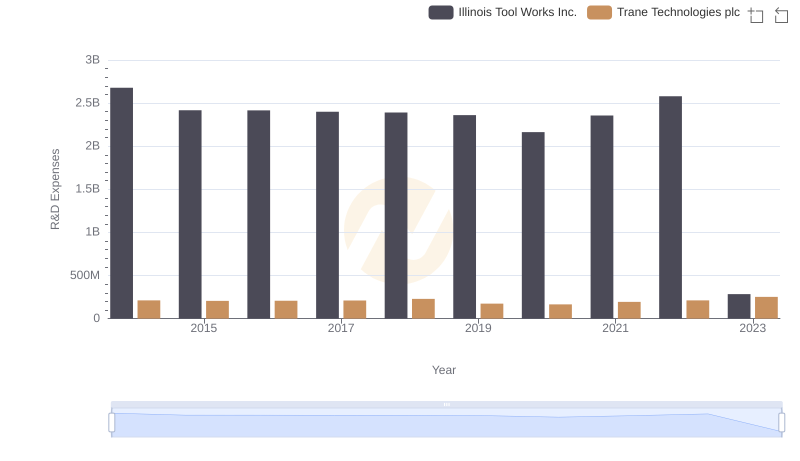
Trane Technologies plc vs Illinois Tool Works Inc.: Strategic Focus on R&D Spending
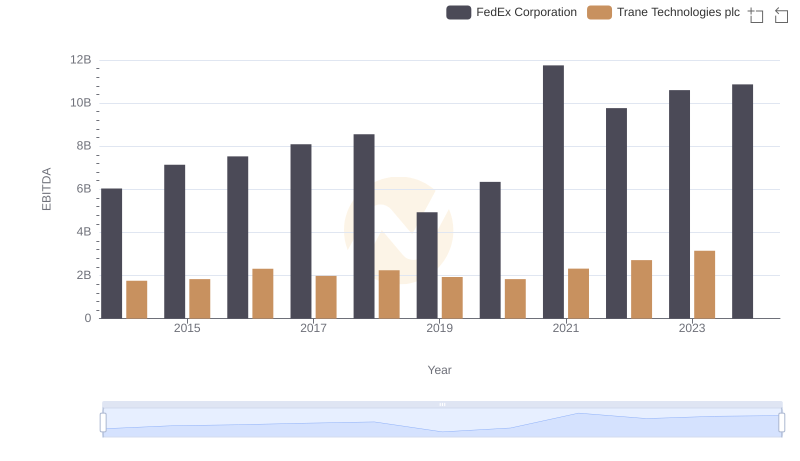
EBITDA Performance Review: Trane Technologies plc vs FedEx Corporation
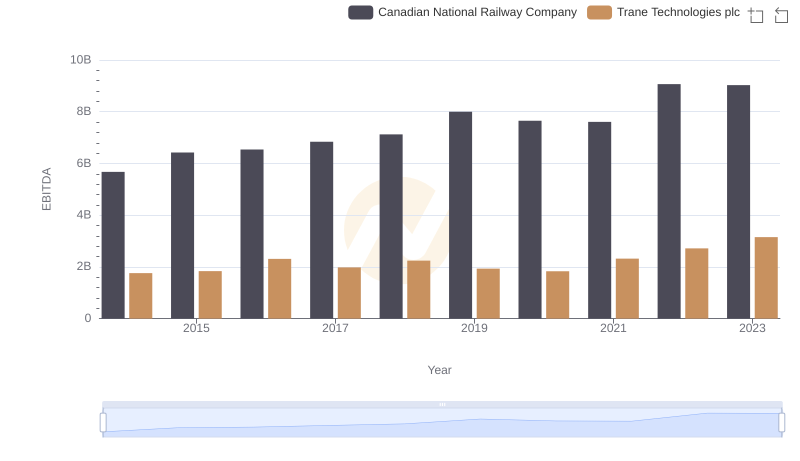
A Professional Review of EBITDA: Trane Technologies plc Compared to Canadian National Railway Company
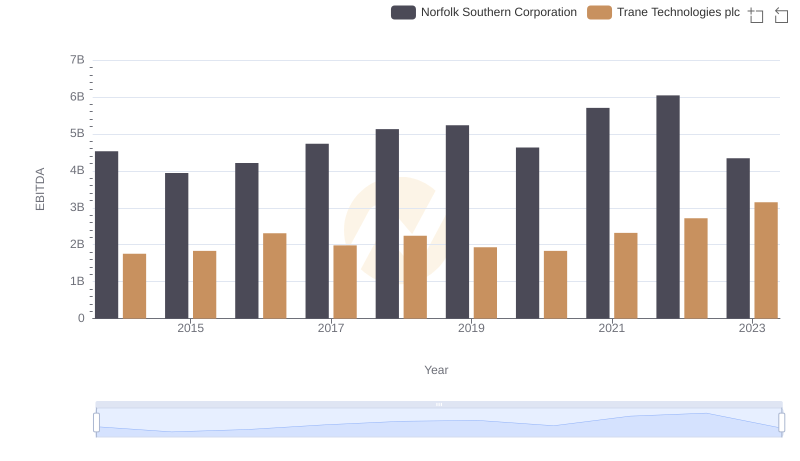
EBITDA Analysis: Evaluating Trane Technologies plc Against Norfolk Southern Corporation
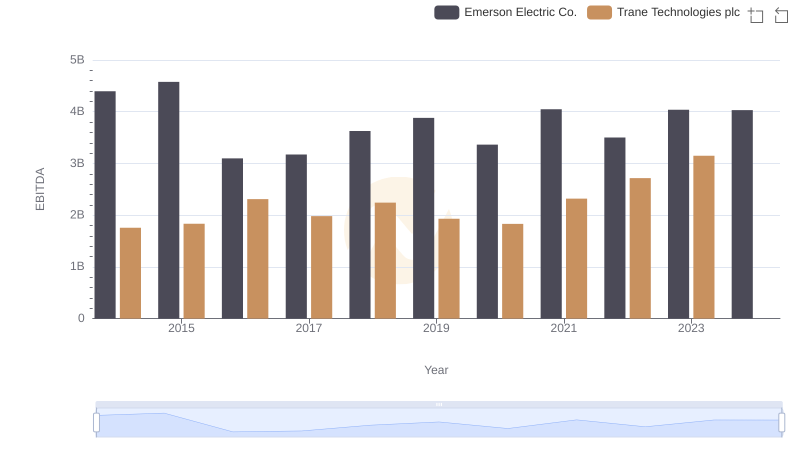
Comparative EBITDA Analysis: Trane Technologies plc vs Emerson Electric Co.
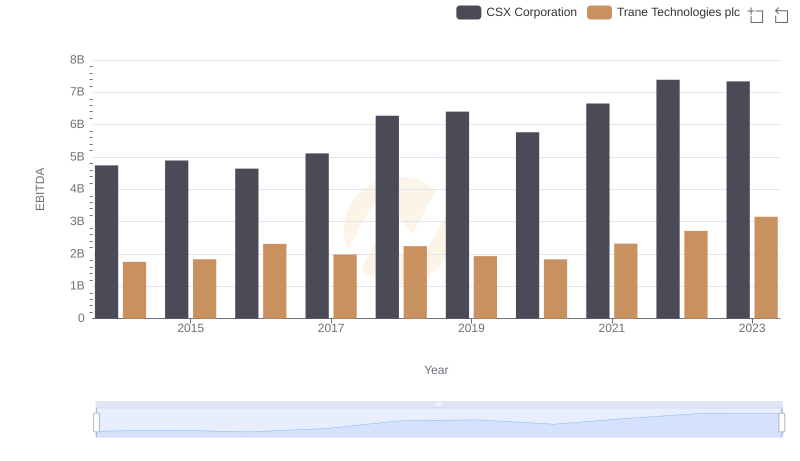
EBITDA Performance Review: Trane Technologies plc vs CSX Corporation