| __timestamp | Norfolk Southern Corporation | Trane Technologies plc |
|---|---|---|
| Wednesday, January 1, 2014 | 4531000000 | 1757000000 |
| Thursday, January 1, 2015 | 3943000000 | 1835000000 |
| Friday, January 1, 2016 | 4212000000 | 2311000000 |
| Sunday, January 1, 2017 | 4733000000 | 1982500000 |
| Monday, January 1, 2018 | 5128000000 | 2242400000 |
| Tuesday, January 1, 2019 | 5233000000 | 1931200000 |
| Wednesday, January 1, 2020 | 4632000000 | 1831900000 |
| Friday, January 1, 2021 | 5705000000 | 2319200000 |
| Saturday, January 1, 2022 | 6043000000 | 2715500000 |
| Sunday, January 1, 2023 | 4340000000 | 3149900000 |
| Monday, January 1, 2024 | 4071000000 | 3859600000 |
Unleashing the power of data
In the ever-evolving landscape of corporate finance, EBITDA (Earnings Before Interest, Taxes, Depreciation, and Amortization) serves as a crucial metric for evaluating a company's operational performance. This analysis delves into the EBITDA trends of Trane Technologies plc and Norfolk Southern Corporation from 2014 to 2023.
Over this period, Norfolk Southern Corporation consistently outperformed Trane Technologies in terms of EBITDA, peaking in 2022 with a 25% increase from its 2014 figures. However, 2023 saw a notable decline of approximately 28%, highlighting potential challenges. In contrast, Trane Technologies demonstrated a steady upward trajectory, culminating in a remarkable 79% growth by 2023 compared to 2014.
This divergence underscores the dynamic nature of these industries, with Trane Technologies capitalizing on its strategic initiatives, while Norfolk Southern navigates the complexities of the transportation sector.
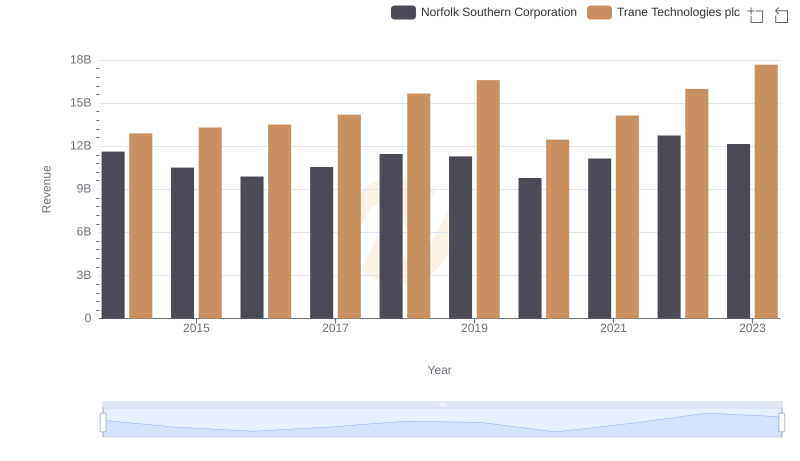
Trane Technologies plc and Norfolk Southern Corporation: A Comprehensive Revenue Analysis
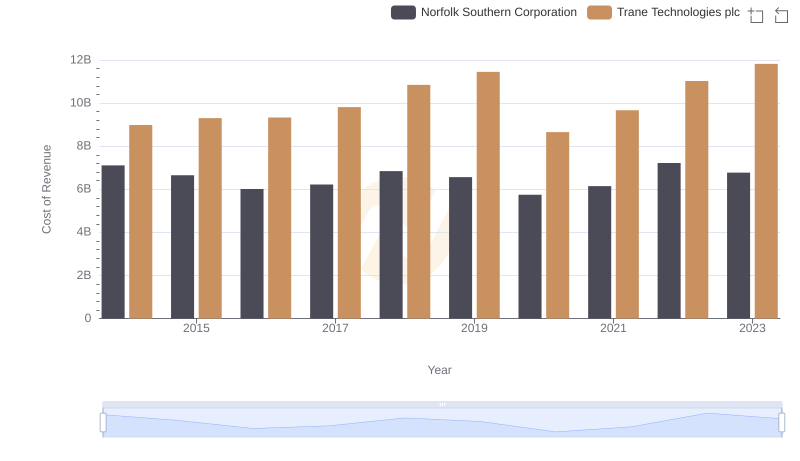
Analyzing Cost of Revenue: Trane Technologies plc and Norfolk Southern Corporation
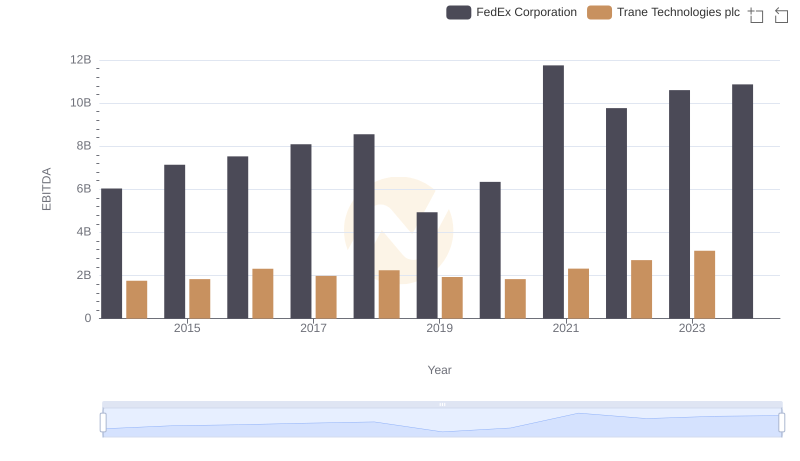
EBITDA Performance Review: Trane Technologies plc vs FedEx Corporation
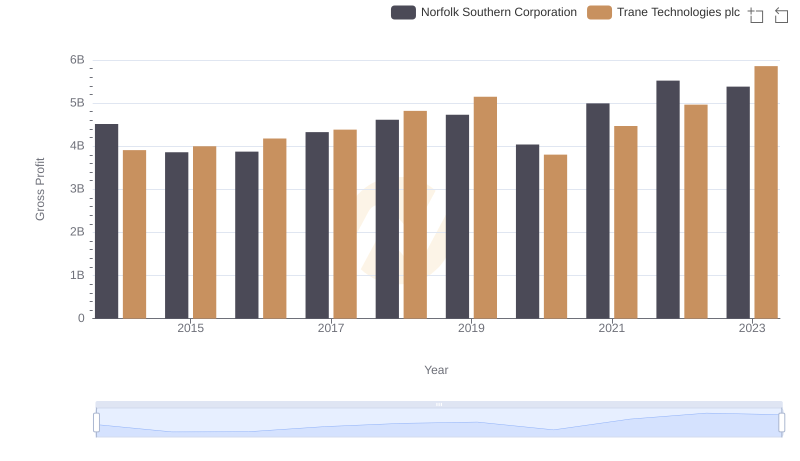
Trane Technologies plc and Norfolk Southern Corporation: A Detailed Gross Profit Analysis
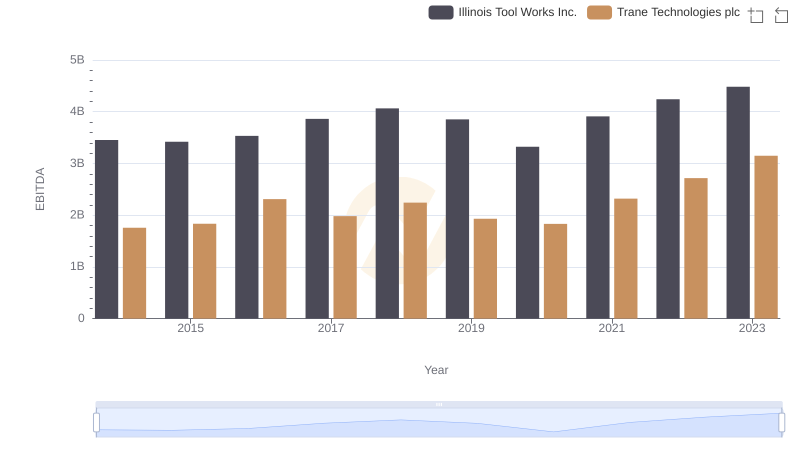
EBITDA Performance Review: Trane Technologies plc vs Illinois Tool Works Inc.
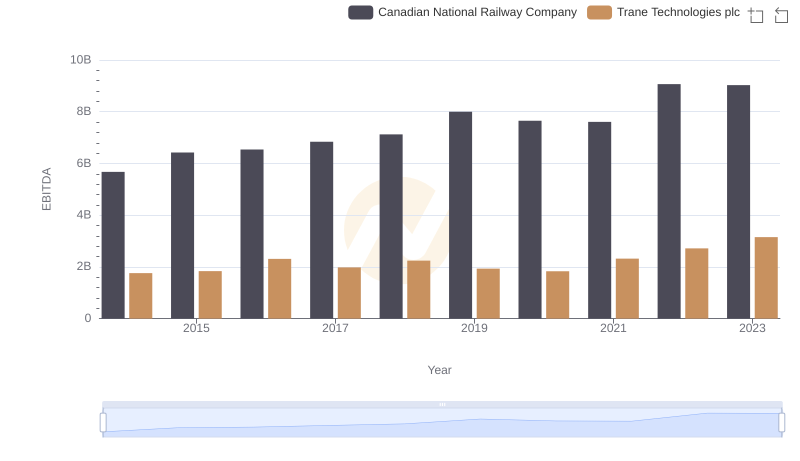
A Professional Review of EBITDA: Trane Technologies plc Compared to Canadian National Railway Company
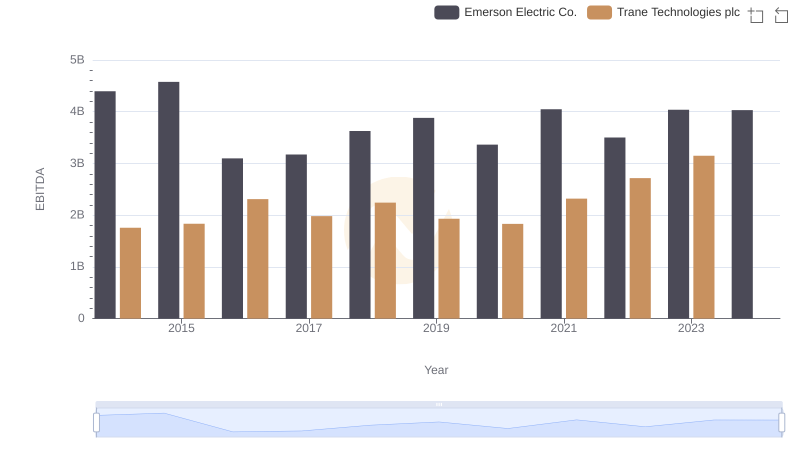
Comparative EBITDA Analysis: Trane Technologies plc vs Emerson Electric Co.
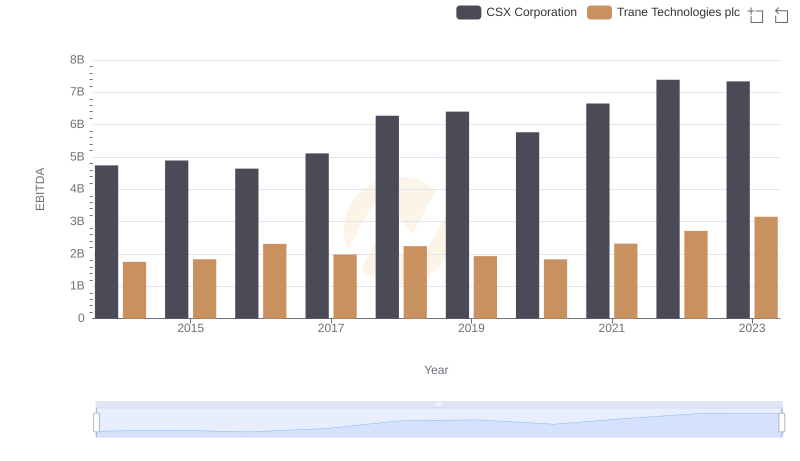
EBITDA Performance Review: Trane Technologies plc vs CSX Corporation
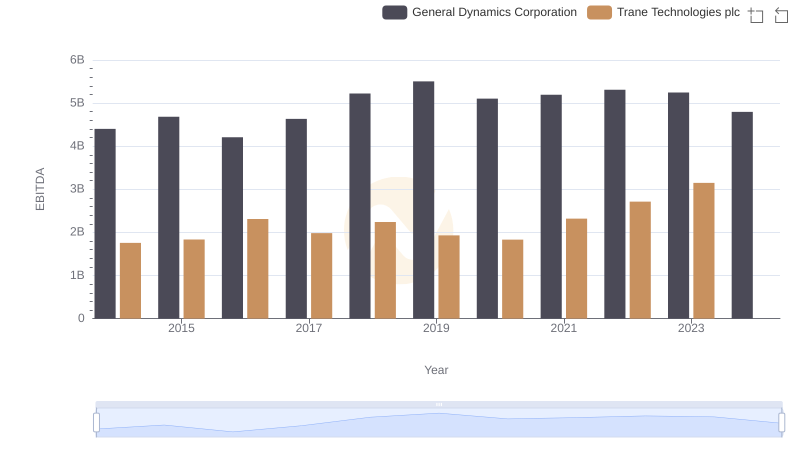
Professional EBITDA Benchmarking: Trane Technologies plc vs General Dynamics Corporation
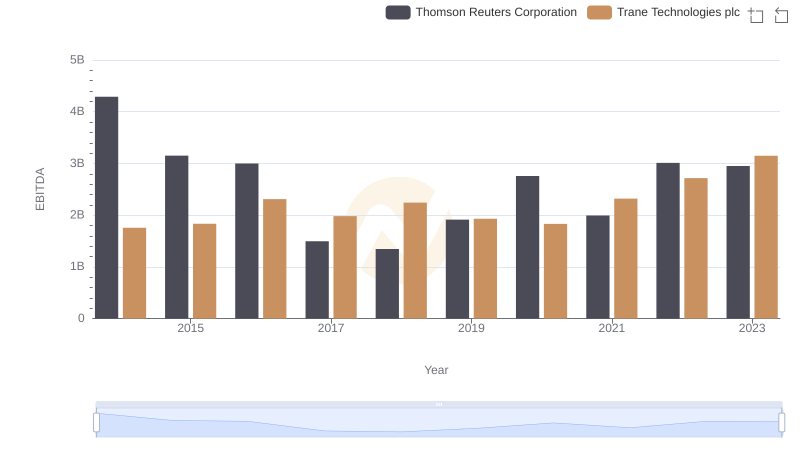
A Side-by-Side Analysis of EBITDA: Trane Technologies plc and Thomson Reuters Corporation