| __timestamp | Global Payments Inc. | Hubbell Incorporated |
|---|---|---|
| Wednesday, January 1, 2014 | 594102000 | 594700000 |
| Thursday, January 1, 2015 | 618109000 | 533600000 |
| Friday, January 1, 2016 | 748136000 | 564700000 |
| Sunday, January 1, 2017 | 1010019000 | 585600000 |
| Monday, January 1, 2018 | 1315968000 | 677500000 |
| Tuesday, January 1, 2019 | 1764994000 | 740900000 |
| Wednesday, January 1, 2020 | 2508393000 | 671400000 |
| Friday, January 1, 2021 | 3233589000 | 661000000 |
| Saturday, January 1, 2022 | 2427684000 | 854300000 |
| Sunday, January 1, 2023 | 3606789000 | 1169700000 |
| Monday, January 1, 2024 | 2333605000 | 1291200000 |
Unleashing insights
In the ever-evolving landscape of financial performance, EBITDA serves as a crucial indicator of a company's operational efficiency. Over the past decade, Global Payments Inc. has demonstrated a remarkable growth trajectory, with its EBITDA surging by over 530% from 2014 to 2023. This growth reflects the company's strategic expansions and robust market positioning. In contrast, Hubbell Incorporated, while maintaining steady growth, has seen its EBITDA increase by approximately 97% during the same period. This comparative analysis highlights the dynamic nature of the financial services and electrical equipment sectors, with Global Payments Inc. capitalizing on digital transformation trends, while Hubbell Incorporated continues to solidify its presence in the industrial sector. As we look to the future, these trends underscore the importance of adaptability and innovation in sustaining financial growth.
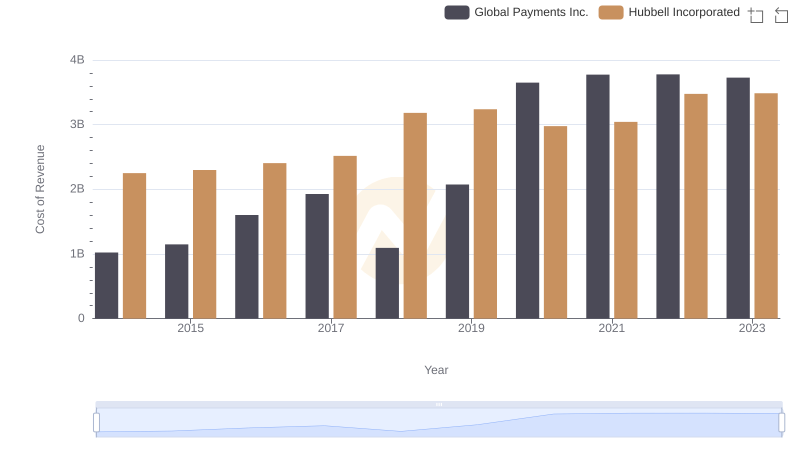
Cost Insights: Breaking Down Global Payments Inc. and Hubbell Incorporated's Expenses
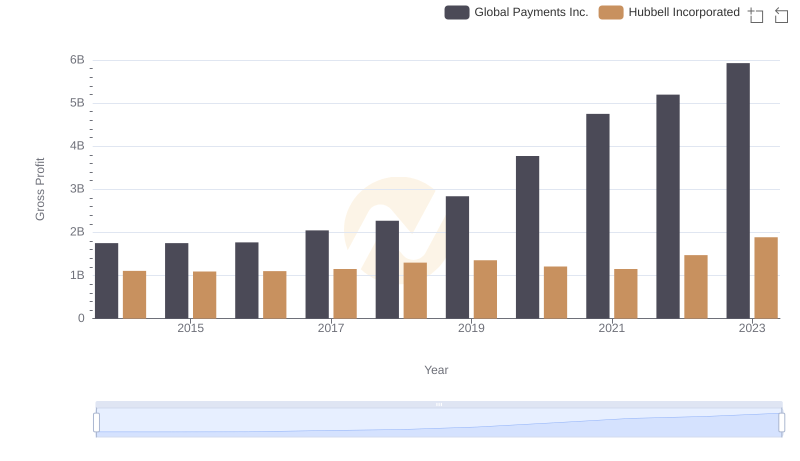
Gross Profit Comparison: Global Payments Inc. and Hubbell Incorporated Trends
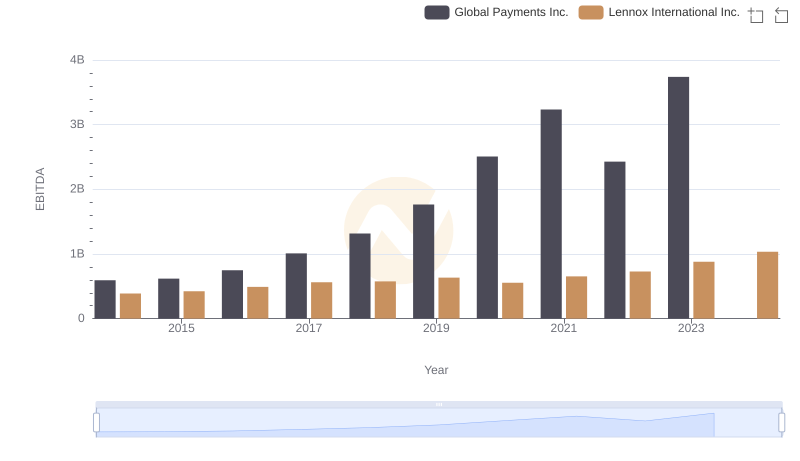
Professional EBITDA Benchmarking: Global Payments Inc. vs Lennox International Inc.
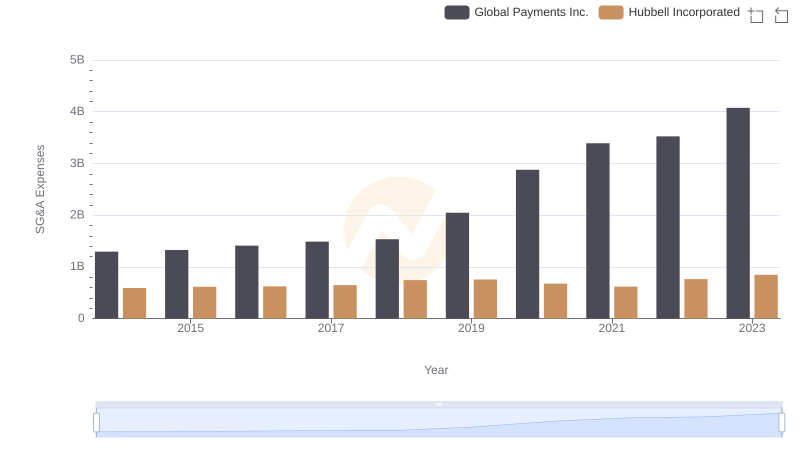
Comparing SG&A Expenses: Global Payments Inc. vs Hubbell Incorporated Trends and Insights
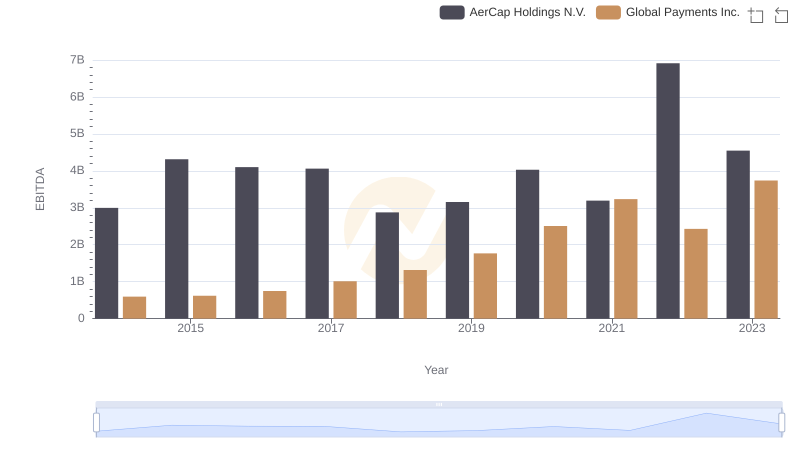
Global Payments Inc. and AerCap Holdings N.V.: A Detailed Examination of EBITDA Performance
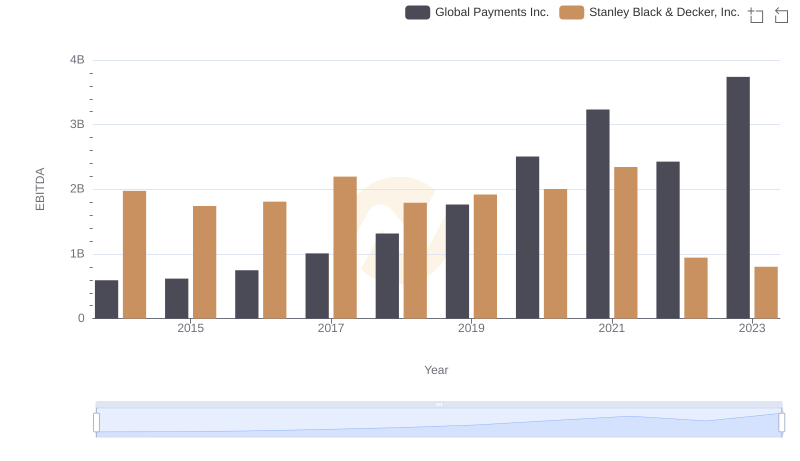
EBITDA Metrics Evaluated: Global Payments Inc. vs Stanley Black & Decker, Inc.
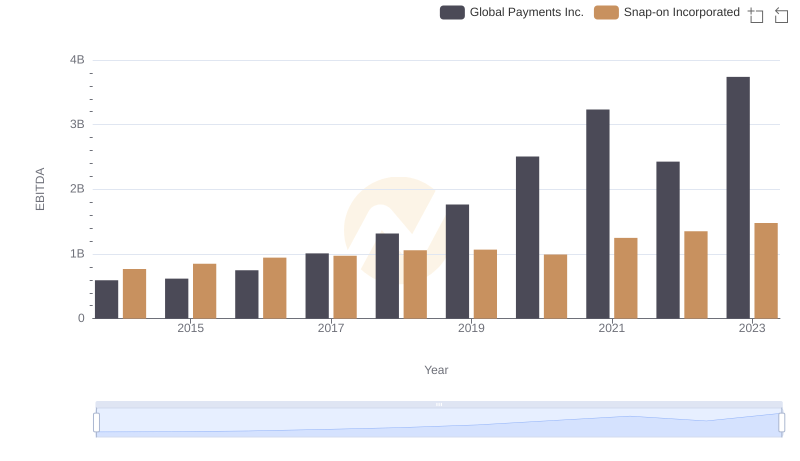
EBITDA Metrics Evaluated: Global Payments Inc. vs Snap-on Incorporated
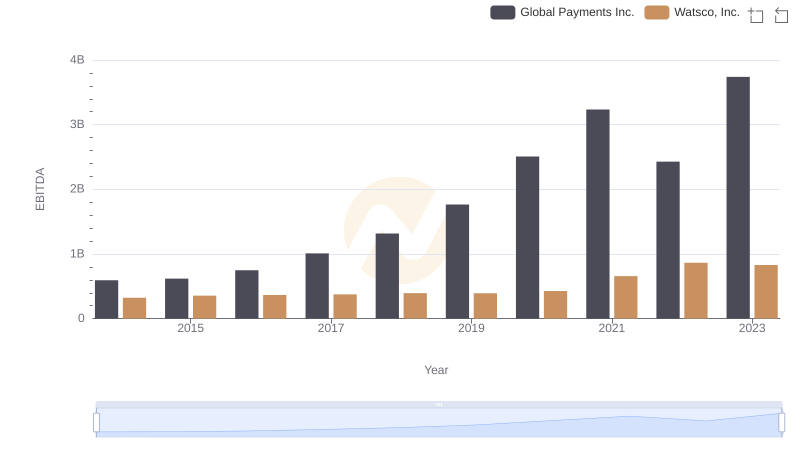
EBITDA Metrics Evaluated: Global Payments Inc. vs Watsco, Inc.
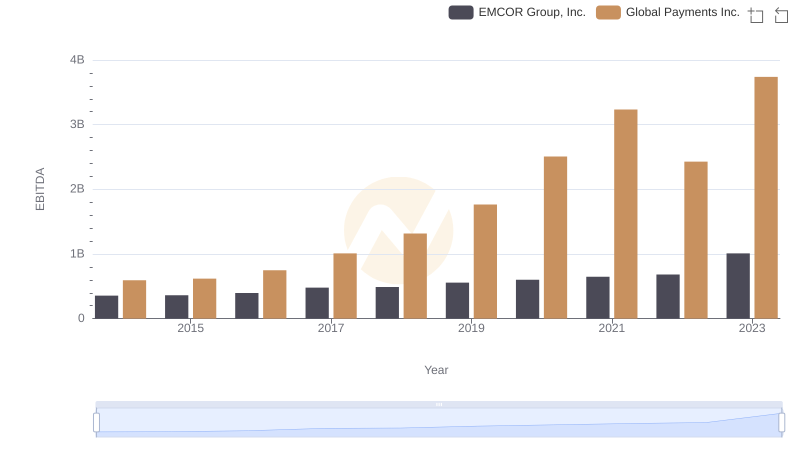
A Side-by-Side Analysis of EBITDA: Global Payments Inc. and EMCOR Group, Inc.

Global Payments Inc. vs TransUnion: In-Depth EBITDA Performance Comparison