| __timestamp | AerCap Holdings N.V. | Global Payments Inc. |
|---|---|---|
| Wednesday, January 1, 2014 | 2997442000 | 594102000 |
| Thursday, January 1, 2015 | 4313510000 | 618109000 |
| Friday, January 1, 2016 | 4101801000 | 748136000 |
| Sunday, January 1, 2017 | 4061381000 | 1010019000 |
| Monday, January 1, 2018 | 2874193000 | 1315968000 |
| Tuesday, January 1, 2019 | 3157061000 | 1764994000 |
| Wednesday, January 1, 2020 | 4028661000 | 2508393000 |
| Friday, January 1, 2021 | 3192341000 | 3233589000 |
| Saturday, January 1, 2022 | 6911148000 | 2427684000 |
| Sunday, January 1, 2023 | 4547656000 | 3606789000 |
| Monday, January 1, 2024 | 2333605000 |
Infusing magic into the data realm
In the ever-evolving landscape of global finance, understanding the EBITDA performance of key players is crucial. AerCap Holdings N.V. and Global Payments Inc. have shown distinct trajectories over the past decade. From 2014 to 2023, AerCap Holdings N.V. demonstrated a robust growth, with EBITDA peaking in 2022 at approximately 7 billion, marking a 130% increase from 2014. In contrast, Global Payments Inc. experienced a steady rise, culminating in 2023 with an EBITDA of nearly 3.7 billion, a sixfold increase from its 2014 figures.
This analysis highlights the resilience and strategic growth of these companies amidst global economic shifts. AerCap's significant leap in 2022 suggests strategic acquisitions or market expansions, while Global Payments' consistent growth reflects its adaptability in the digital payment sector. Investors and analysts should consider these trends when evaluating future opportunities.
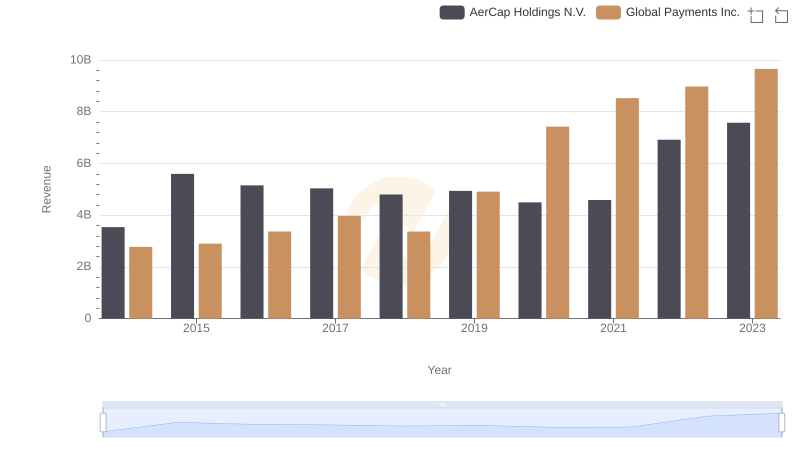
Global Payments Inc. vs AerCap Holdings N.V.: Examining Key Revenue Metrics
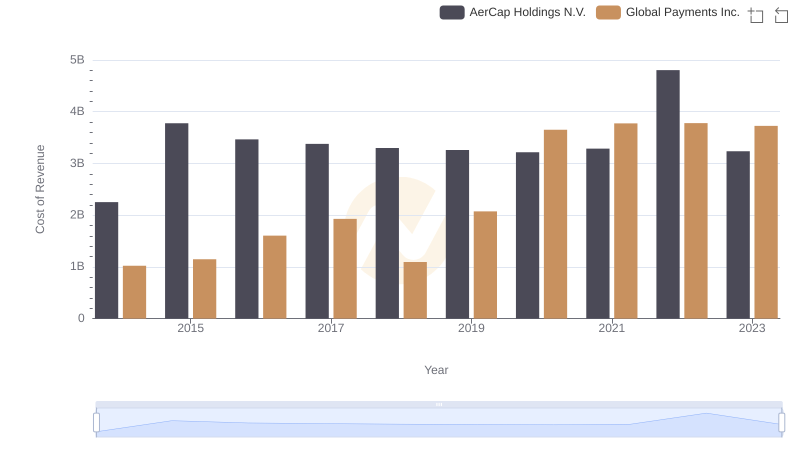
Cost of Revenue: Key Insights for Global Payments Inc. and AerCap Holdings N.V.
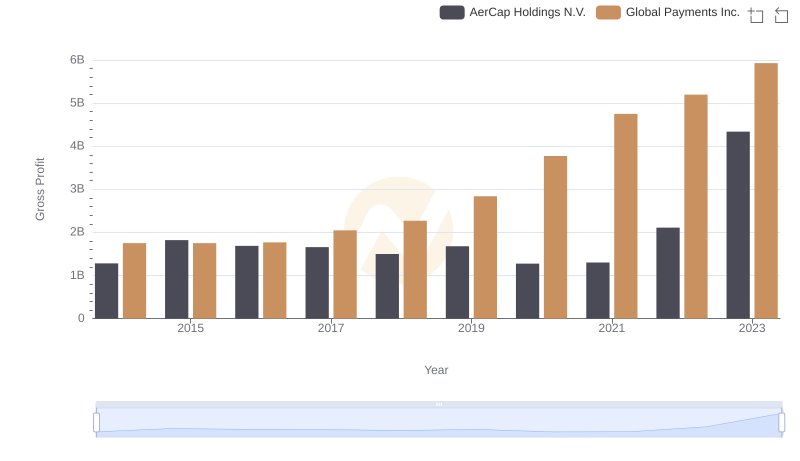
Gross Profit Comparison: Global Payments Inc. and AerCap Holdings N.V. Trends
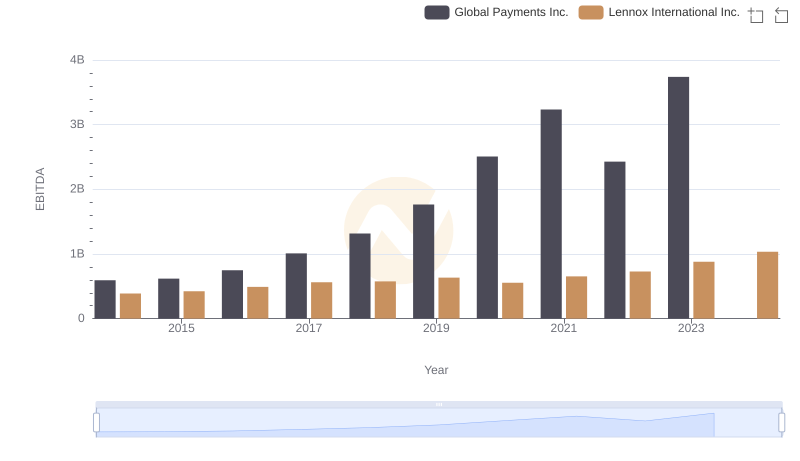
Professional EBITDA Benchmarking: Global Payments Inc. vs Lennox International Inc.
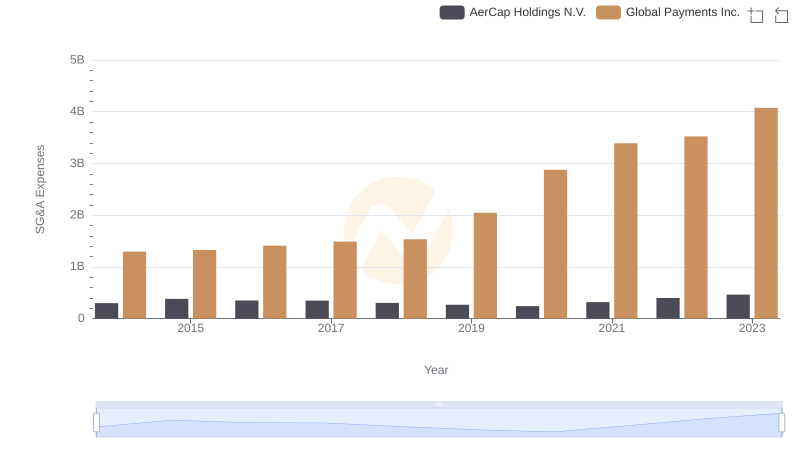
Cost Management Insights: SG&A Expenses for Global Payments Inc. and AerCap Holdings N.V.
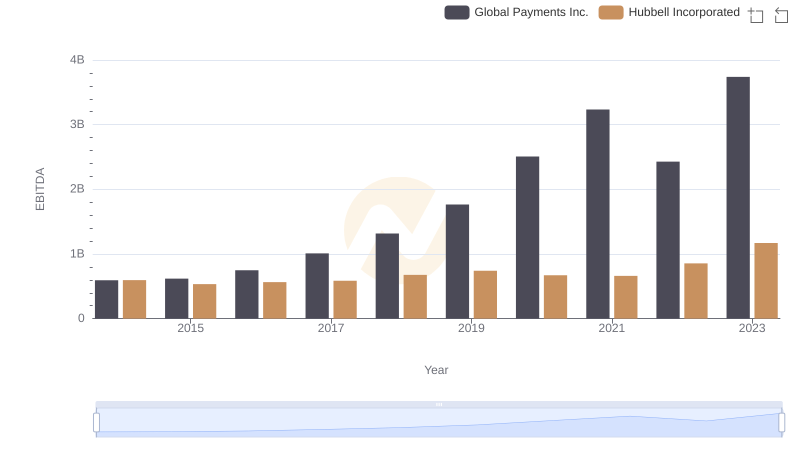
Comparative EBITDA Analysis: Global Payments Inc. vs Hubbell Incorporated
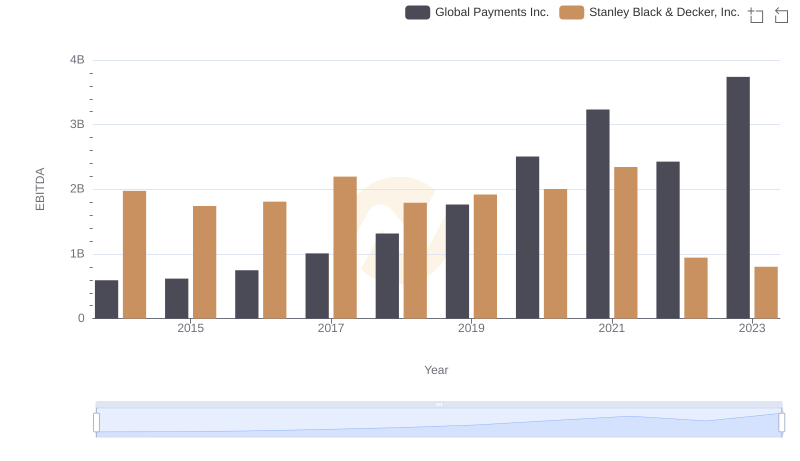
EBITDA Metrics Evaluated: Global Payments Inc. vs Stanley Black & Decker, Inc.
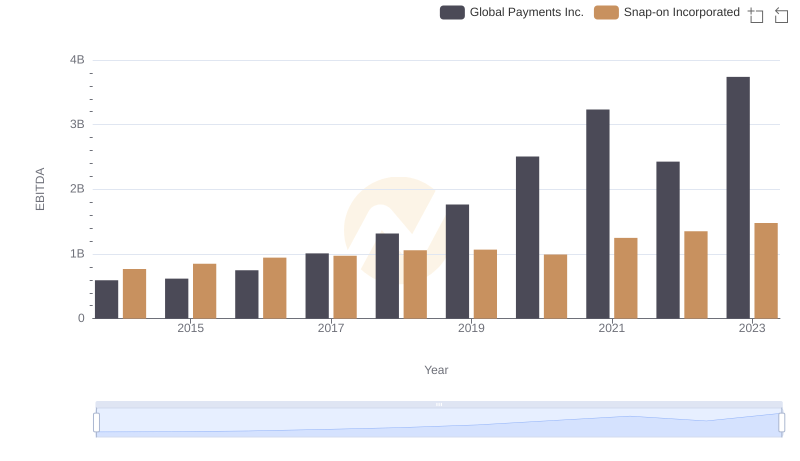
EBITDA Metrics Evaluated: Global Payments Inc. vs Snap-on Incorporated
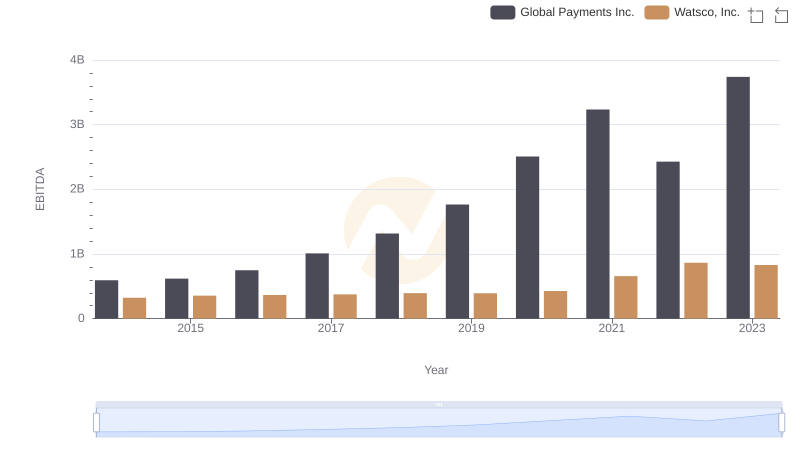
EBITDA Metrics Evaluated: Global Payments Inc. vs Watsco, Inc.
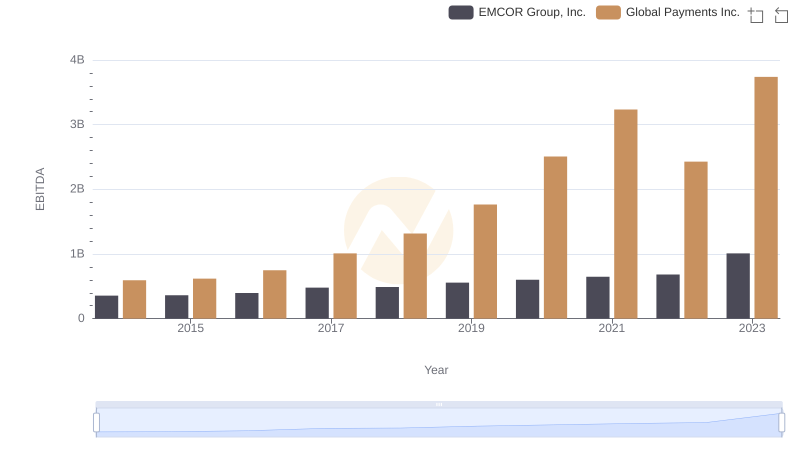
A Side-by-Side Analysis of EBITDA: Global Payments Inc. and EMCOR Group, Inc.

Global Payments Inc. vs TransUnion: In-Depth EBITDA Performance Comparison