| __timestamp | Global Payments Inc. | Hubbell Incorporated |
|---|---|---|
| Wednesday, January 1, 2014 | 1022107000 | 2250400000 |
| Thursday, January 1, 2015 | 1147639000 | 2298600000 |
| Friday, January 1, 2016 | 1603532000 | 2404500000 |
| Sunday, January 1, 2017 | 1928037000 | 2516900000 |
| Monday, January 1, 2018 | 1095014000 | 3181300000 |
| Tuesday, January 1, 2019 | 2073803000 | 3238300000 |
| Wednesday, January 1, 2020 | 3650727000 | 2976700000 |
| Friday, January 1, 2021 | 3773725000 | 3042600000 |
| Saturday, January 1, 2022 | 3778617000 | 3476300000 |
| Sunday, January 1, 2023 | 3727521000 | 3484800000 |
| Monday, January 1, 2024 | 3760116000 | 3724400000 |
Unleashing insights
In the ever-evolving landscape of corporate finance, understanding cost structures is pivotal. This analysis delves into the cost of revenue trends for Global Payments Inc. and Hubbell Incorporated from 2014 to 2023. Over this decade, Global Payments Inc. witnessed a staggering 265% increase in its cost of revenue, peaking in 2022. Meanwhile, Hubbell Incorporated experienced a more modest 55% rise, with its highest costs recorded in 2023.
These insights offer a window into the financial strategies and market responses of these industry giants.
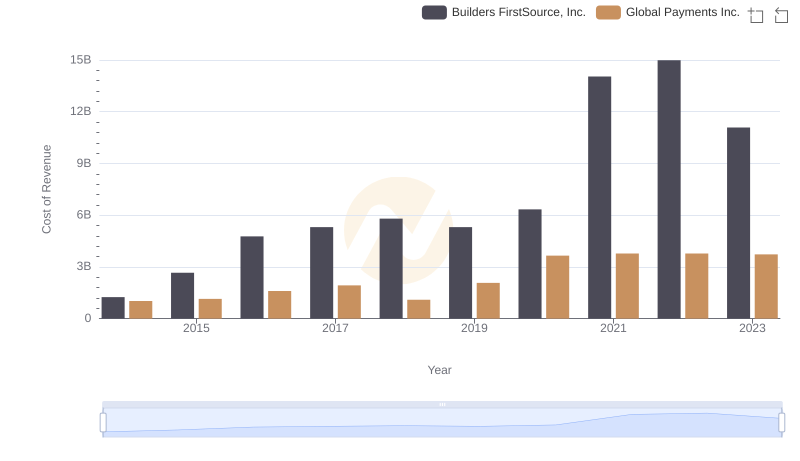
Global Payments Inc. vs Builders FirstSource, Inc.: Efficiency in Cost of Revenue Explored
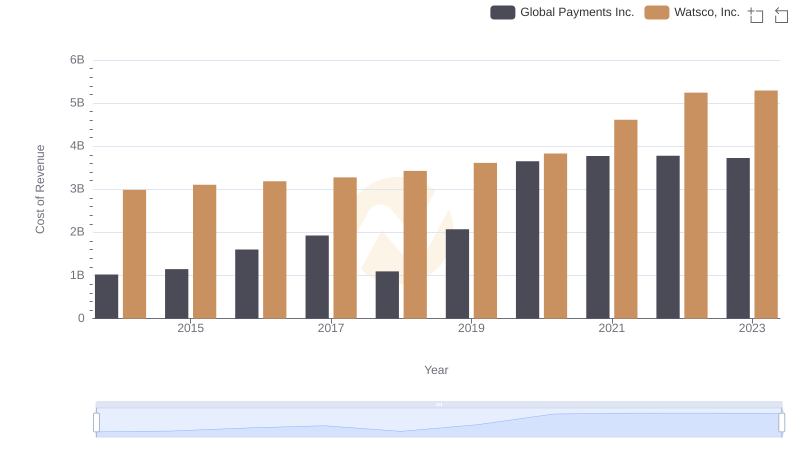
Global Payments Inc. vs Watsco, Inc.: Efficiency in Cost of Revenue Explored

Global Payments Inc. vs EMCOR Group, Inc.: Efficiency in Cost of Revenue Explored
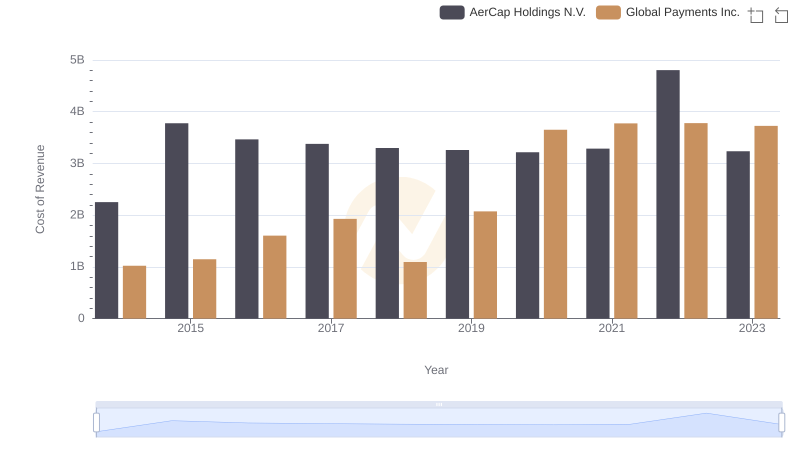
Cost of Revenue: Key Insights for Global Payments Inc. and AerCap Holdings N.V.
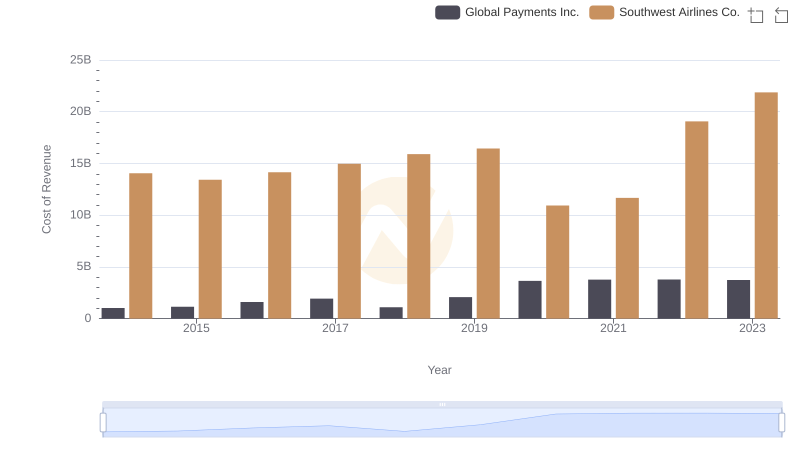
Analyzing Cost of Revenue: Global Payments Inc. and Southwest Airlines Co.
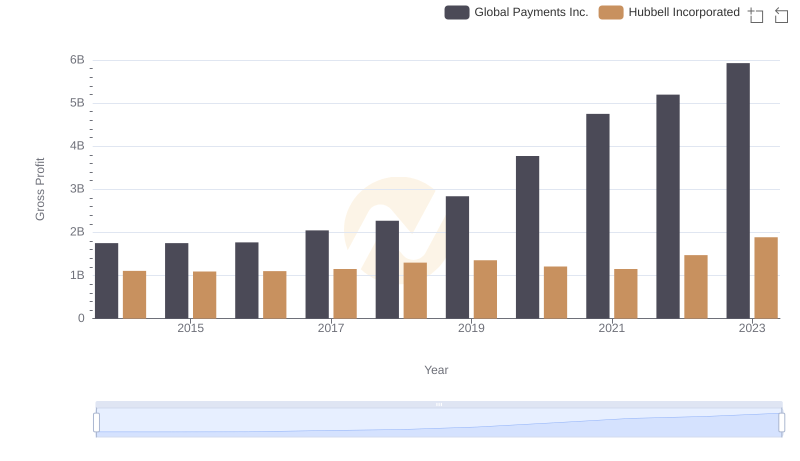
Gross Profit Comparison: Global Payments Inc. and Hubbell Incorporated Trends
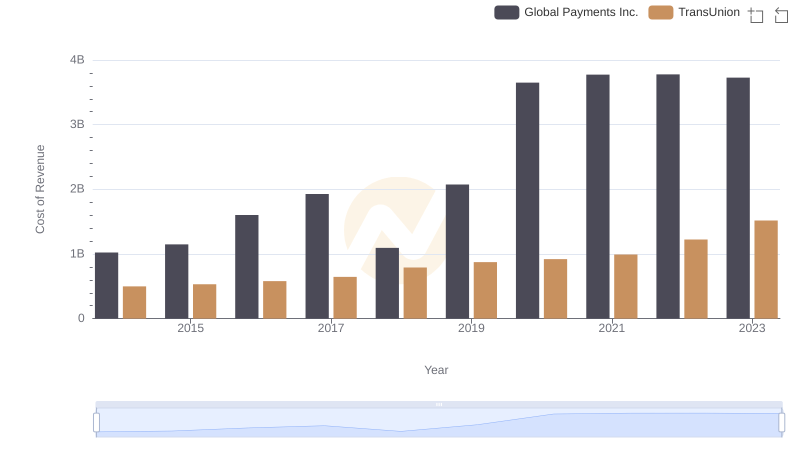
Cost of Revenue Trends: Global Payments Inc. vs TransUnion
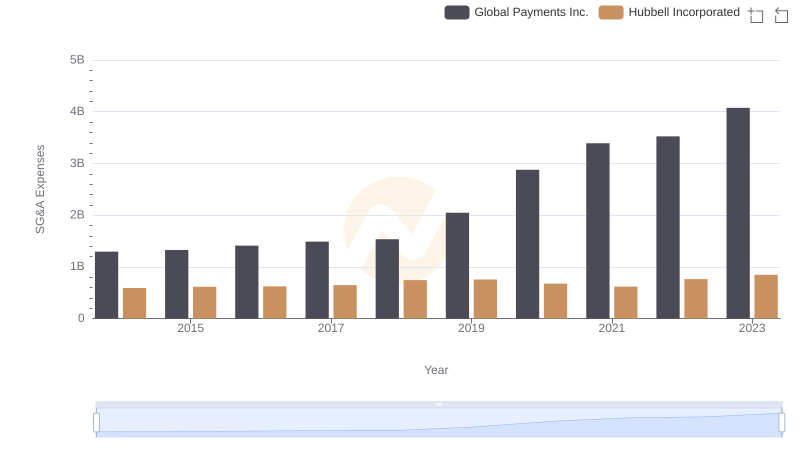
Comparing SG&A Expenses: Global Payments Inc. vs Hubbell Incorporated Trends and Insights
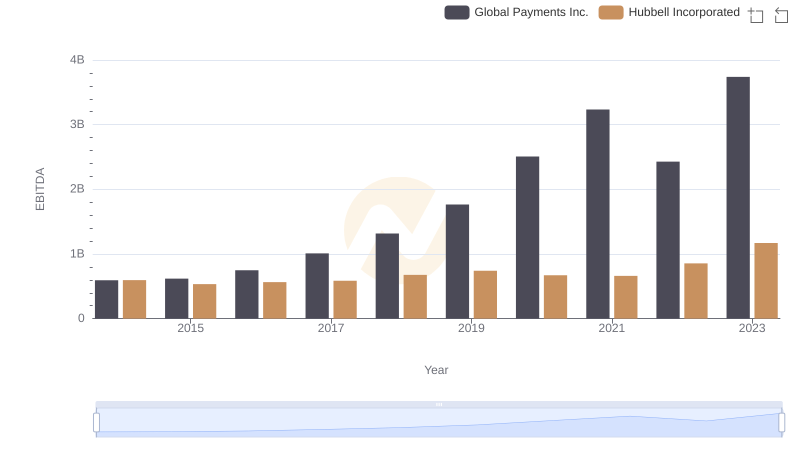
Comparative EBITDA Analysis: Global Payments Inc. vs Hubbell Incorporated