| __timestamp | Global Payments Inc. | Lennox International Inc. |
|---|---|---|
| Wednesday, January 1, 2014 | 594102000 | 387700000 |
| Thursday, January 1, 2015 | 618109000 | 423600000 |
| Friday, January 1, 2016 | 748136000 | 490800000 |
| Sunday, January 1, 2017 | 1010019000 | 562900000 |
| Monday, January 1, 2018 | 1315968000 | 575200000 |
| Tuesday, January 1, 2019 | 1764994000 | 633300000 |
| Wednesday, January 1, 2020 | 2508393000 | 553900000 |
| Friday, January 1, 2021 | 3233589000 | 652500000 |
| Saturday, January 1, 2022 | 2427684000 | 729000000 |
| Sunday, January 1, 2023 | 3606789000 | 879500000 |
| Monday, January 1, 2024 | 2333605000 | 1034800000 |
Unleashing insights
In the ever-evolving landscape of global finance, understanding the financial health of companies is crucial. This analysis focuses on the EBITDA performance of Global Payments Inc. and Lennox International Inc. from 2014 to 2023. Over this period, Global Payments Inc. demonstrated a remarkable growth trajectory, with EBITDA increasing by over 500%, peaking in 2023. In contrast, Lennox International Inc. showed a steady, albeit slower, growth of approximately 130%.
This comparative analysis underscores the dynamic nature of financial performance, offering valuable insights for investors and stakeholders.

Revenue Showdown: Global Payments Inc. vs Lennox International Inc.

Cost of Revenue Trends: Global Payments Inc. vs Lennox International Inc.
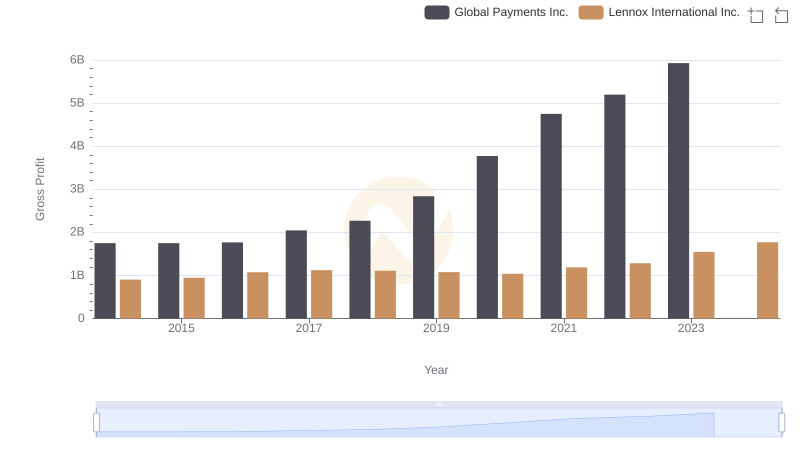
Key Insights on Gross Profit: Global Payments Inc. vs Lennox International Inc.
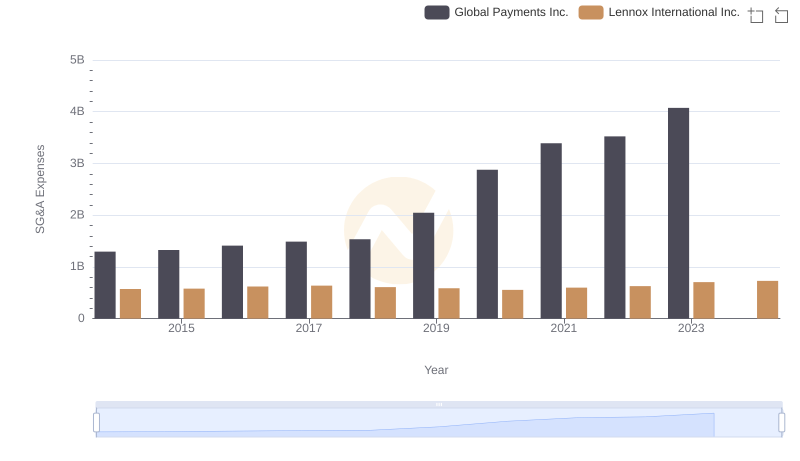
Selling, General, and Administrative Costs: Global Payments Inc. vs Lennox International Inc.
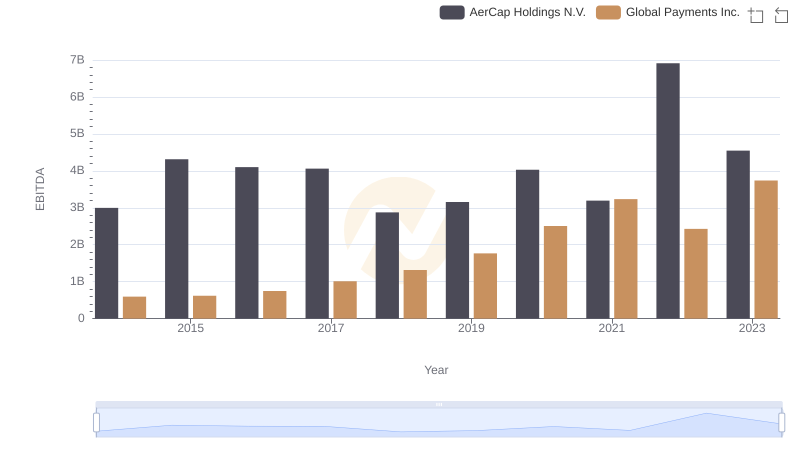
Global Payments Inc. and AerCap Holdings N.V.: A Detailed Examination of EBITDA Performance
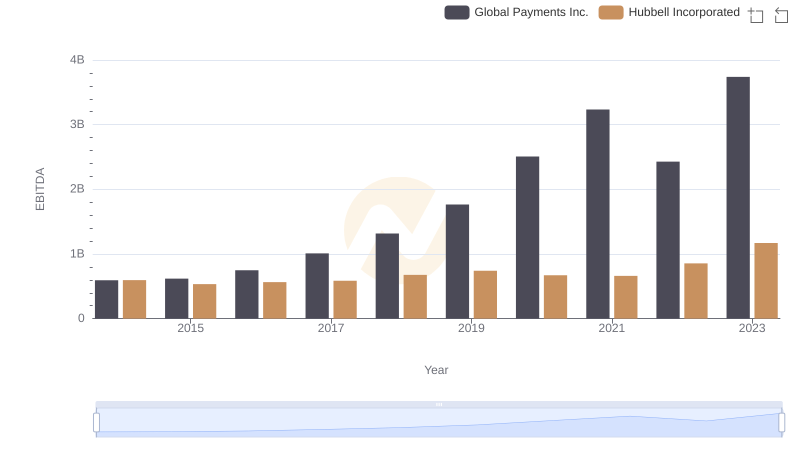
Comparative EBITDA Analysis: Global Payments Inc. vs Hubbell Incorporated
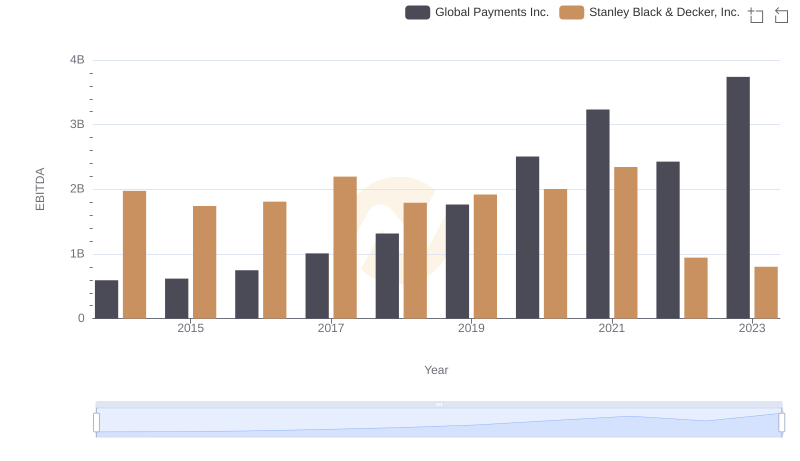
EBITDA Metrics Evaluated: Global Payments Inc. vs Stanley Black & Decker, Inc.
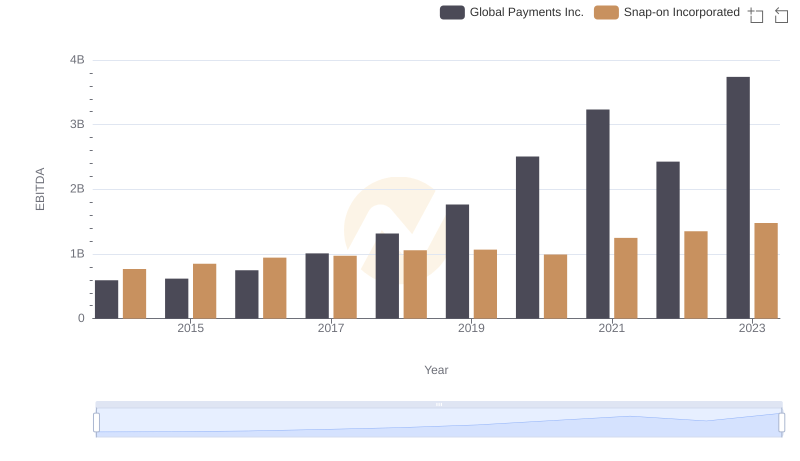
EBITDA Metrics Evaluated: Global Payments Inc. vs Snap-on Incorporated
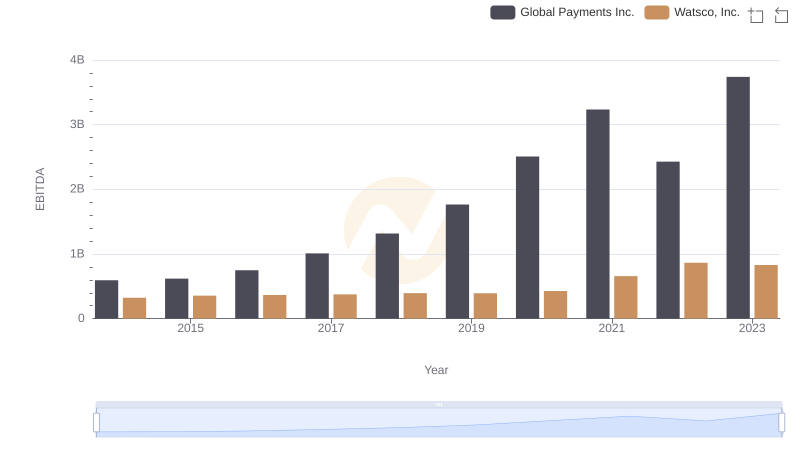
EBITDA Metrics Evaluated: Global Payments Inc. vs Watsco, Inc.
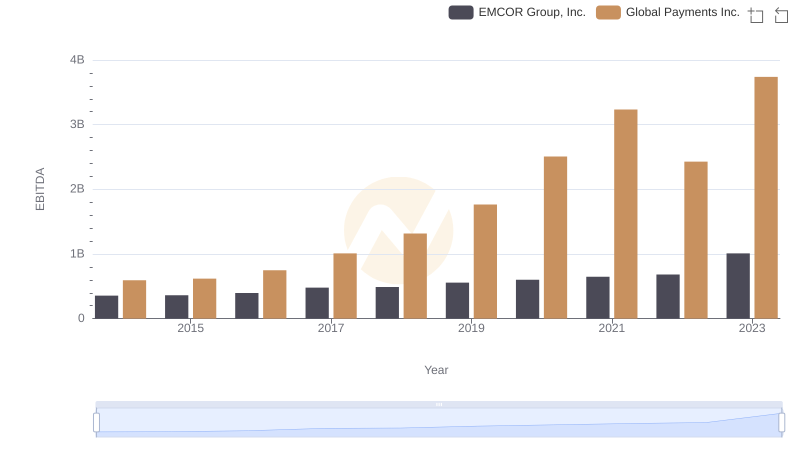
A Side-by-Side Analysis of EBITDA: Global Payments Inc. and EMCOR Group, Inc.