| __timestamp | Global Payments Inc. | Hubbell Incorporated |
|---|---|---|
| Wednesday, January 1, 2014 | 1751611000 | 1109000000 |
| Thursday, January 1, 2015 | 1750511000 | 1091800000 |
| Friday, January 1, 2016 | 1767444000 | 1100700000 |
| Sunday, January 1, 2017 | 2047126000 | 1151900000 |
| Monday, January 1, 2018 | 2271352000 | 1300400000 |
| Tuesday, January 1, 2019 | 2838089000 | 1352700000 |
| Wednesday, January 1, 2020 | 3772831000 | 1209300000 |
| Friday, January 1, 2021 | 4750037000 | 1151500000 |
| Saturday, January 1, 2022 | 5196898000 | 1471600000 |
| Sunday, January 1, 2023 | 5926898000 | 1888100000 |
| Monday, January 1, 2024 | 6345778000 | 1904100000 |
In pursuit of knowledge
In the ever-evolving landscape of financial performance, Global Payments Inc. and Hubbell Incorporated have showcased intriguing trends over the past decade. From 2014 to 2023, Global Payments Inc. has seen its gross profit soar by approximately 238%, reflecting its robust expansion and strategic market positioning. In contrast, Hubbell Incorporated, while experiencing a more modest growth of around 70%, has demonstrated consistent resilience in a competitive industry.
These trends offer a fascinating glimpse into the financial dynamics of two major players in their respective sectors.
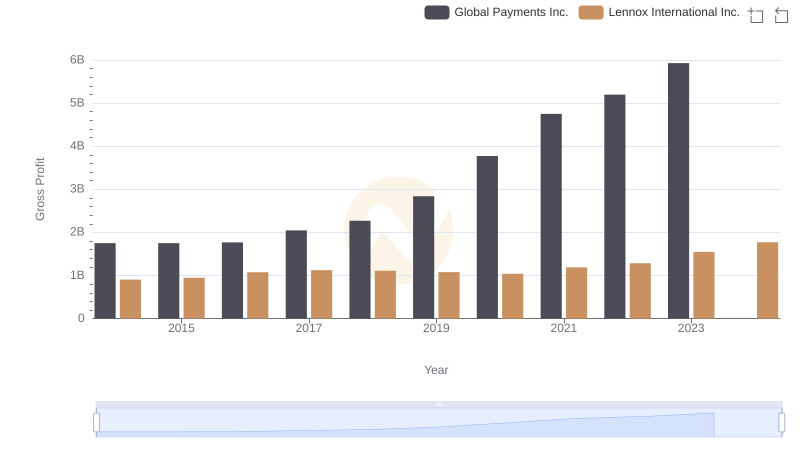
Key Insights on Gross Profit: Global Payments Inc. vs Lennox International Inc.
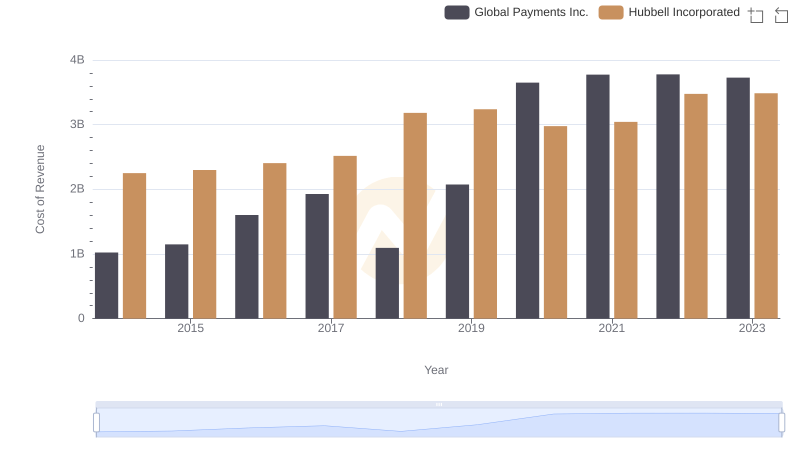
Cost Insights: Breaking Down Global Payments Inc. and Hubbell Incorporated's Expenses
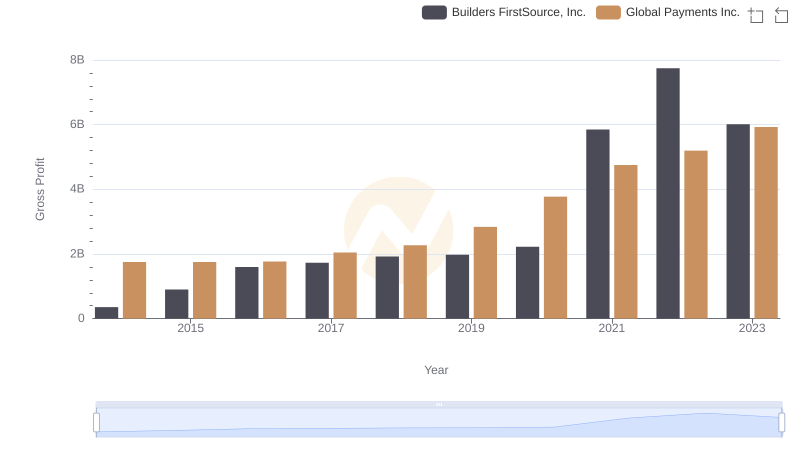
Who Generates Higher Gross Profit? Global Payments Inc. or Builders FirstSource, Inc.
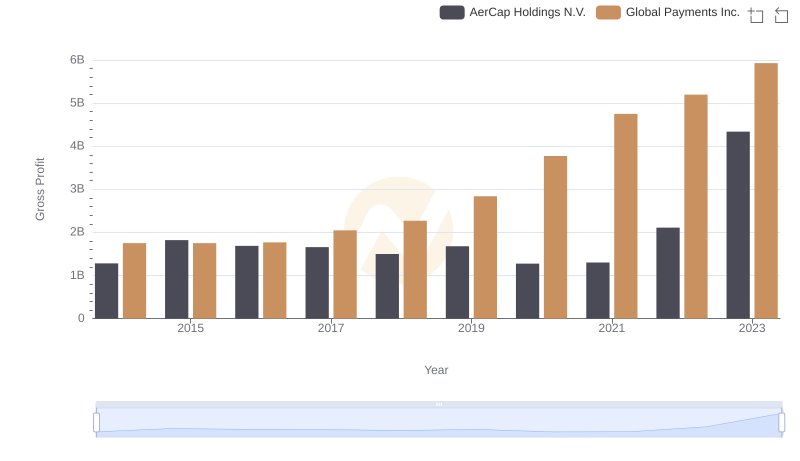
Gross Profit Comparison: Global Payments Inc. and AerCap Holdings N.V. Trends
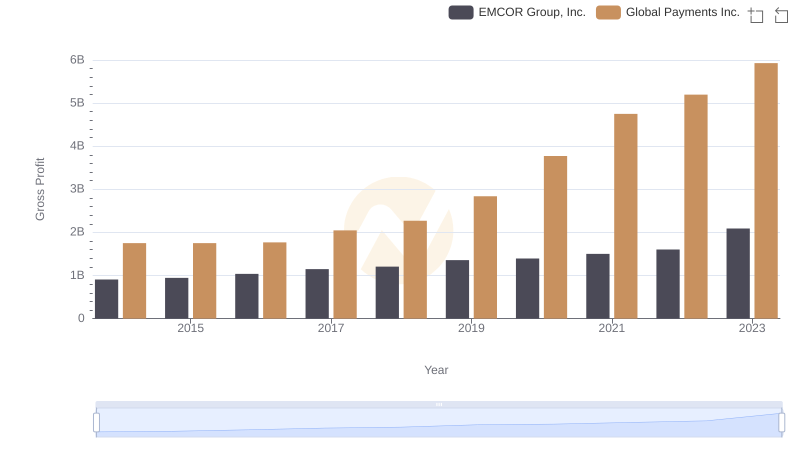
Key Insights on Gross Profit: Global Payments Inc. vs EMCOR Group, Inc.
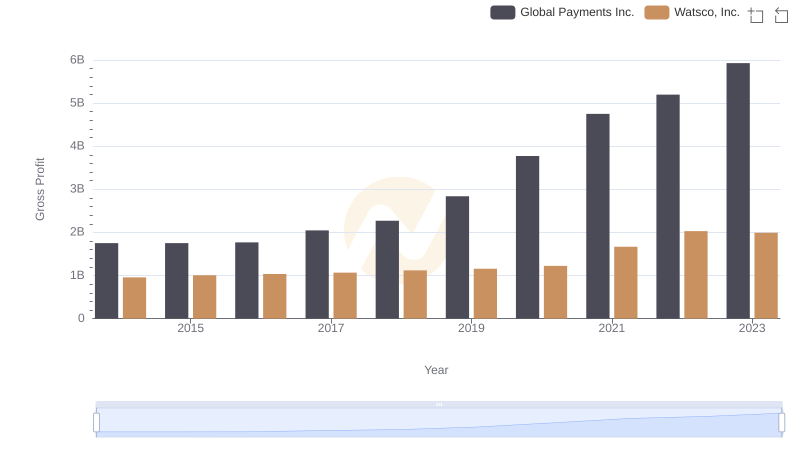
Gross Profit Comparison: Global Payments Inc. and Watsco, Inc. Trends
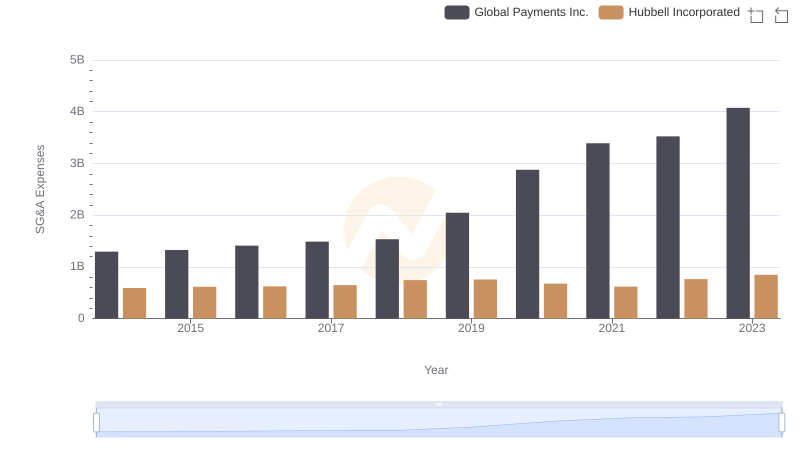
Comparing SG&A Expenses: Global Payments Inc. vs Hubbell Incorporated Trends and Insights
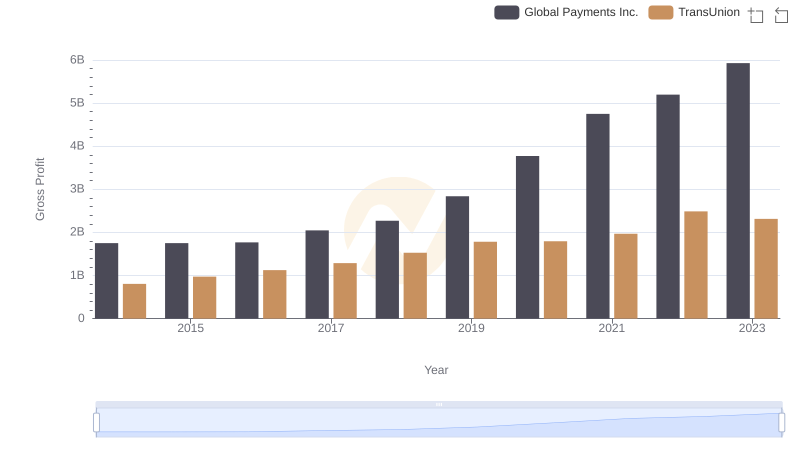
Global Payments Inc. and TransUnion: A Detailed Gross Profit Analysis
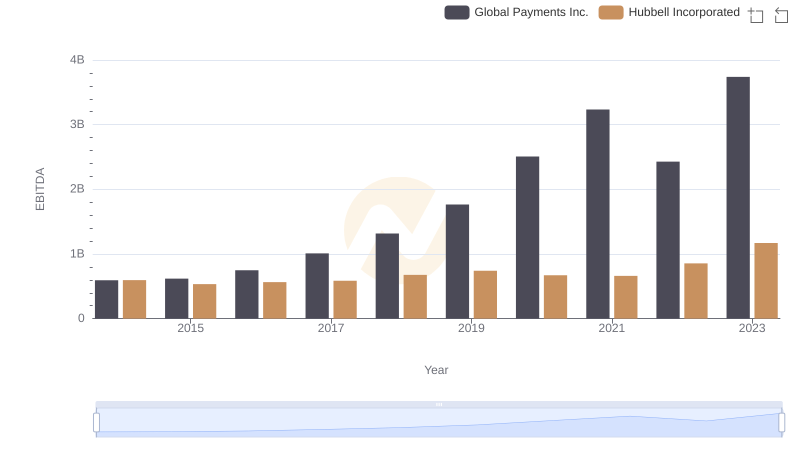
Comparative EBITDA Analysis: Global Payments Inc. vs Hubbell Incorporated