| __timestamp | EMCOR Group, Inc. | Jacobs Engineering Group Inc. |
|---|---|---|
| Wednesday, January 1, 2014 | 626478000 | 1545716000 |
| Thursday, January 1, 2015 | 656573000 | 1522811000 |
| Friday, January 1, 2016 | 725538000 | 1429233000 |
| Sunday, January 1, 2017 | 757062000 | 1379983000 |
| Monday, January 1, 2018 | 799157000 | 2180399000 |
| Tuesday, January 1, 2019 | 893453000 | 2072177000 |
| Wednesday, January 1, 2020 | 903584000 | 2050695000 |
| Friday, January 1, 2021 | 970937000 | 2355683000 |
| Saturday, January 1, 2022 | 1038717000 | 2409190000 |
| Sunday, January 1, 2023 | 1211233000 | 2398078000 |
| Monday, January 1, 2024 | 2140320000 |
Unlocking the unknown
In the competitive landscape of engineering and construction, understanding the financial dynamics of industry leaders is crucial. This analysis delves into the Selling, General, and Administrative (SG&A) expenses of EMCOR Group, Inc. and Jacobs Engineering Group Inc. from 2014 to 2023. Over this period, Jacobs consistently outpaced EMCOR in SG&A spending, with Jacobs' expenses peaking at approximately 2.4 billion in 2022, a 56% increase from 2014. In contrast, EMCOR's SG&A expenses grew by 93%, reaching around 1.2 billion in 2023. This trend highlights Jacobs' larger scale of operations and possibly more extensive administrative frameworks. However, EMCOR's rapid growth in SG&A expenses suggests aggressive expansion strategies. Notably, data for 2024 is incomplete, indicating potential shifts in financial strategies. This comparative insight offers a window into the operational priorities and growth trajectories of these industry giants.
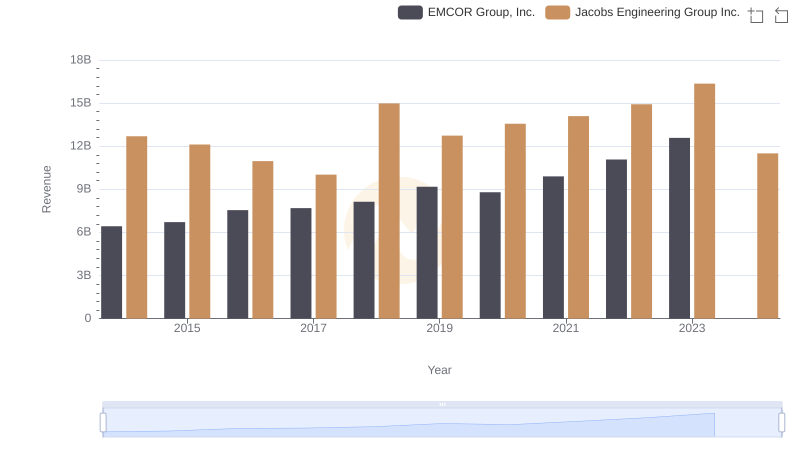
EMCOR Group, Inc. vs Jacobs Engineering Group Inc.: Examining Key Revenue Metrics
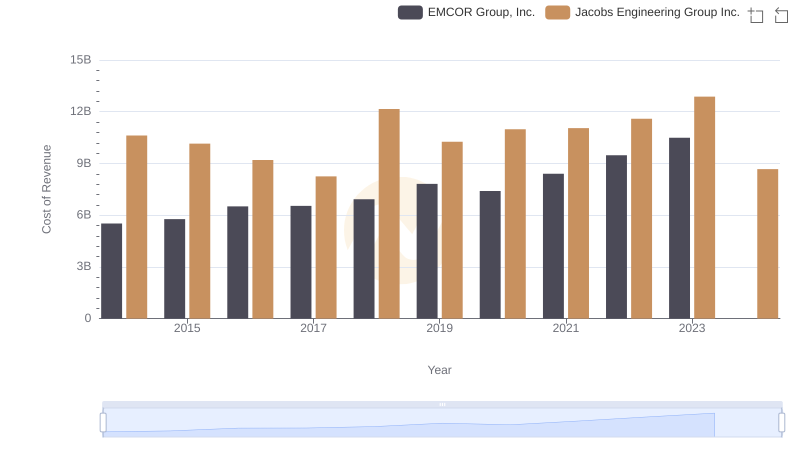
EMCOR Group, Inc. vs Jacobs Engineering Group Inc.: Efficiency in Cost of Revenue Explored
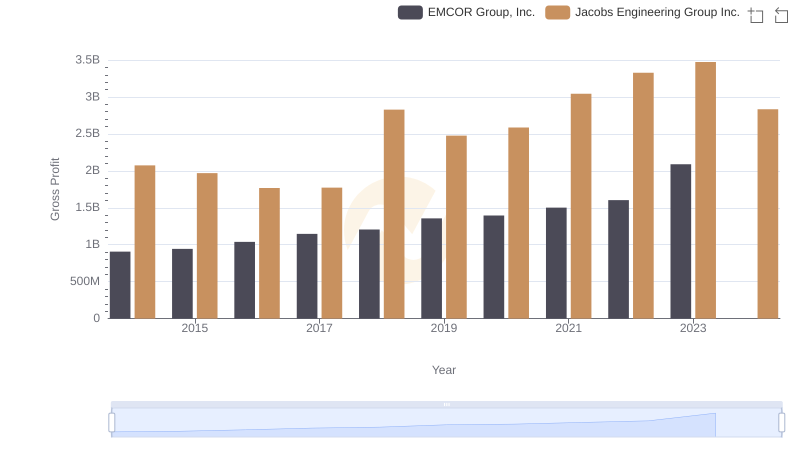
Who Generates Higher Gross Profit? EMCOR Group, Inc. or Jacobs Engineering Group Inc.

Breaking Down SG&A Expenses: EMCOR Group, Inc. vs J.B. Hunt Transport Services, Inc.
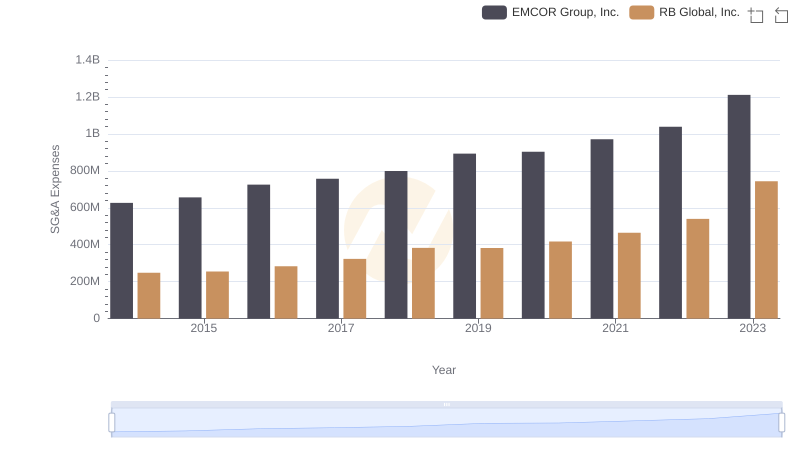
EMCOR Group, Inc. and RB Global, Inc.: SG&A Spending Patterns Compared
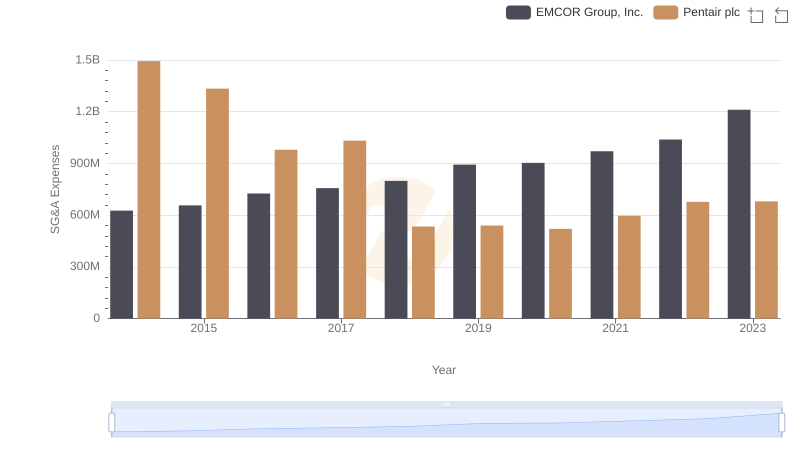
EMCOR Group, Inc. and Pentair plc: SG&A Spending Patterns Compared
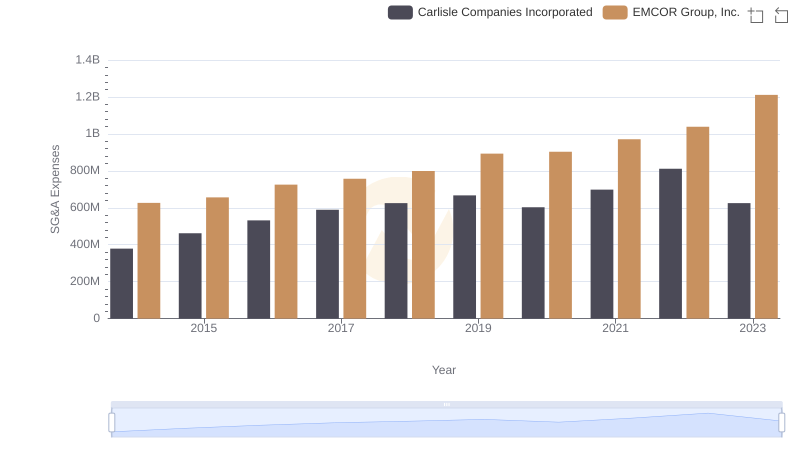
Breaking Down SG&A Expenses: EMCOR Group, Inc. vs Carlisle Companies Incorporated
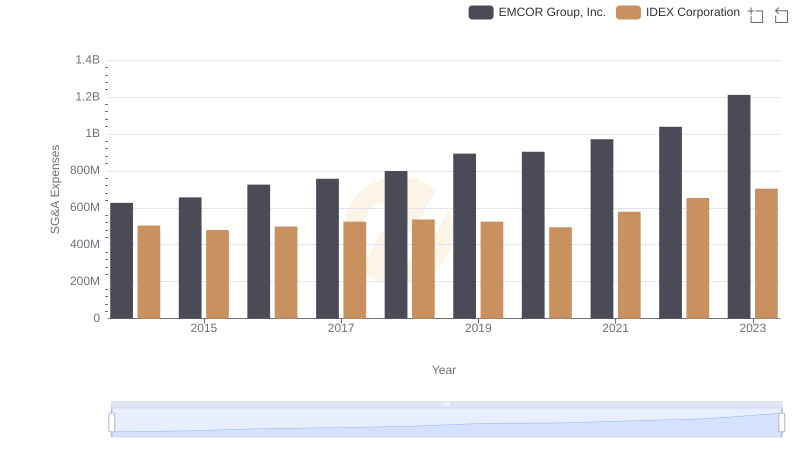
Breaking Down SG&A Expenses: EMCOR Group, Inc. vs IDEX Corporation
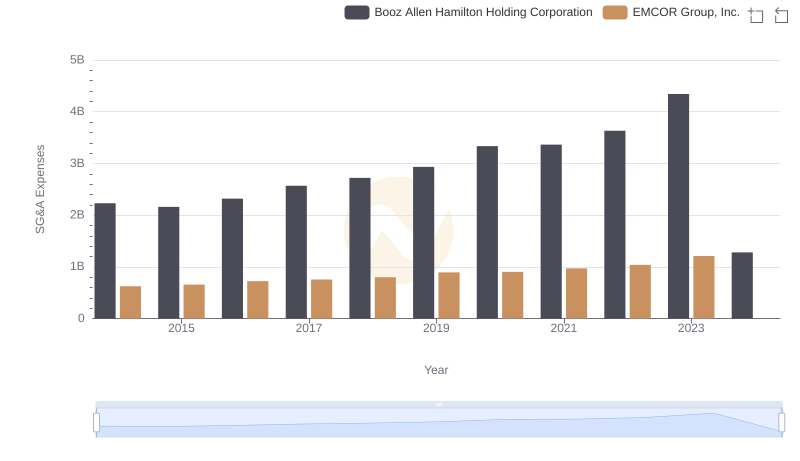
EMCOR Group, Inc. vs Booz Allen Hamilton Holding Corporation: SG&A Expense Trends
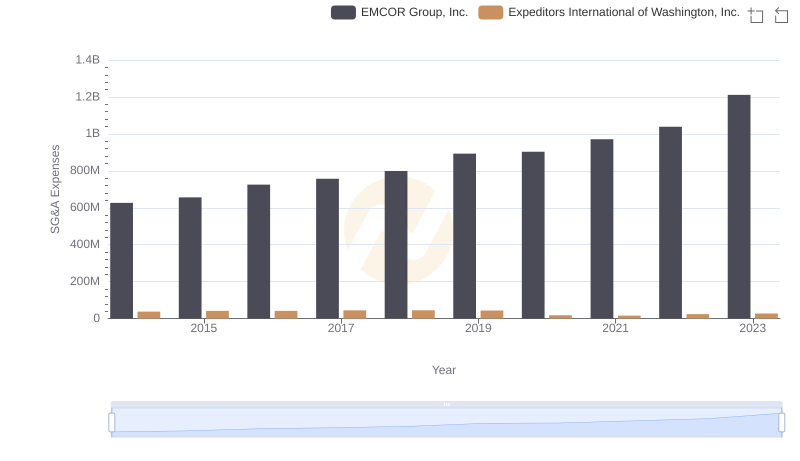
EMCOR Group, Inc. and Expeditors International of Washington, Inc.: SG&A Spending Patterns Compared
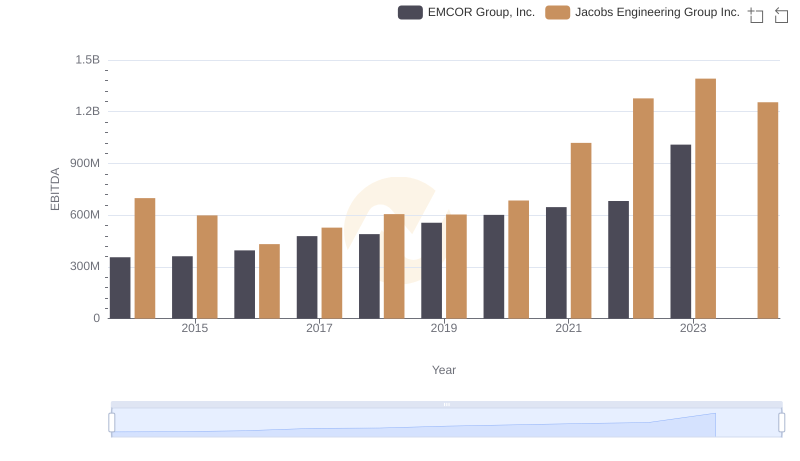
Comparative EBITDA Analysis: EMCOR Group, Inc. vs Jacobs Engineering Group Inc.