| __timestamp | Cintas Corporation | Ferrovial SE |
|---|---|---|
| Wednesday, January 1, 2014 | 793811000 | 983000000 |
| Thursday, January 1, 2015 | 877761000 | 1027000000 |
| Friday, January 1, 2016 | 933728000 | 943000000 |
| Sunday, January 1, 2017 | 968293000 | 515000000 |
| Monday, January 1, 2018 | 1227852000 | 661000000 |
| Tuesday, January 1, 2019 | 1564228000 | 121000000 |
| Wednesday, January 1, 2020 | 1542737000 | 116000000 |
| Friday, January 1, 2021 | 1773591000 | 610000000 |
| Saturday, January 1, 2022 | 1990046000 | 756000000 |
| Sunday, January 1, 2023 | 2221676000 | 1524000000 |
| Monday, January 1, 2024 | 2523857000 |
Infusing magic into the data realm
In the ever-evolving landscape of global business, the financial health of companies is often gauged by their EBITDA, a key indicator of operational performance. Over the past decade, Cintas Corporation and Ferrovial SE have showcased contrasting trajectories in their EBITDA growth.
From 2014 to 2023, Cintas Corporation has demonstrated a robust upward trend, with its EBITDA surging by approximately 218%, reflecting its strategic expansions and operational efficiencies. In contrast, Ferrovial SE experienced a more volatile journey, with its EBITDA peaking in 2023, marking a significant recovery from previous years.
This comparative analysis highlights the resilience and strategic prowess of Cintas Corporation, while Ferrovial SE's fluctuating figures underscore the challenges faced in the European infrastructure sector. As we look to the future, these trends offer valuable insights into the strategic directions of these industry giants.
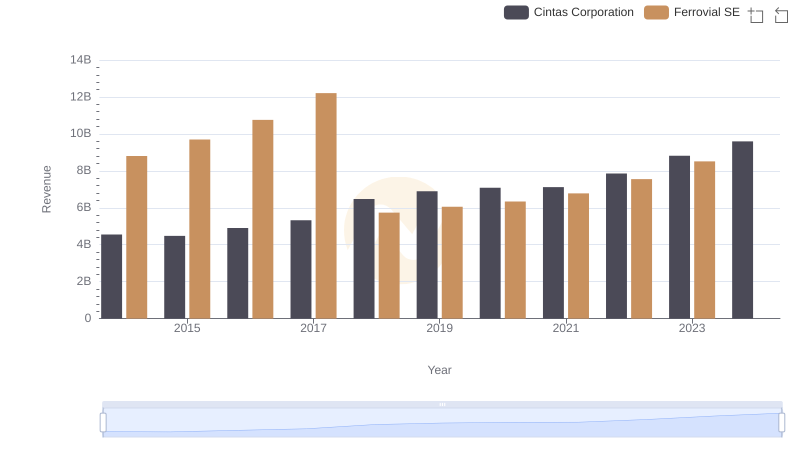
Cintas Corporation or Ferrovial SE: Who Leads in Yearly Revenue?
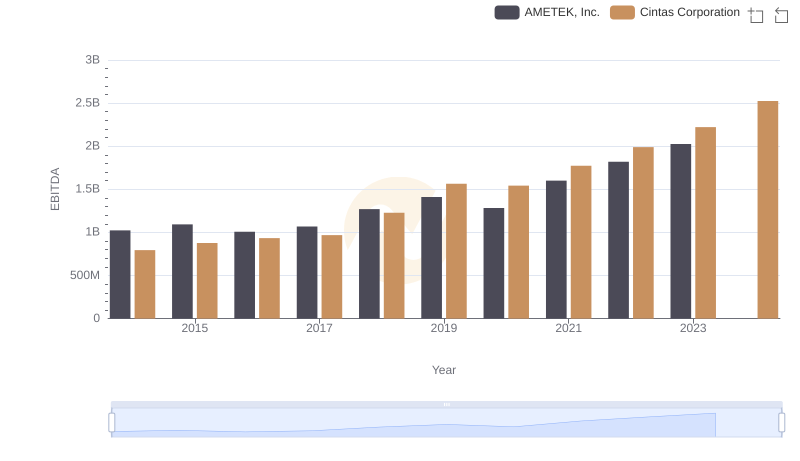
Cintas Corporation vs AMETEK, Inc.: In-Depth EBITDA Performance Comparison
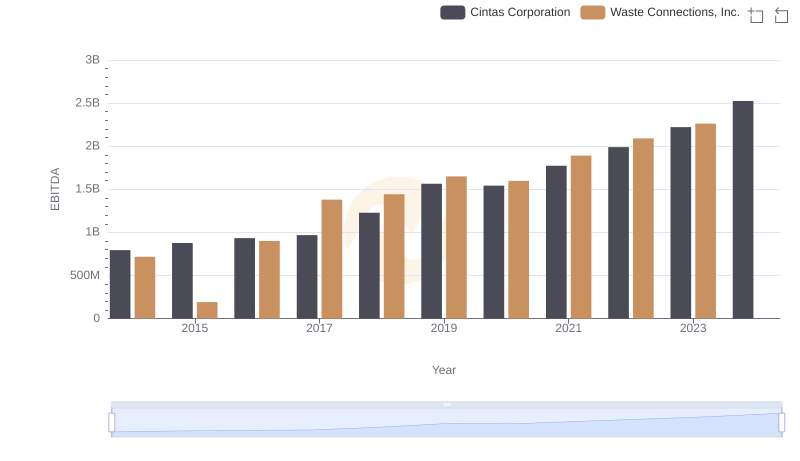
A Side-by-Side Analysis of EBITDA: Cintas Corporation and Waste Connections, Inc.
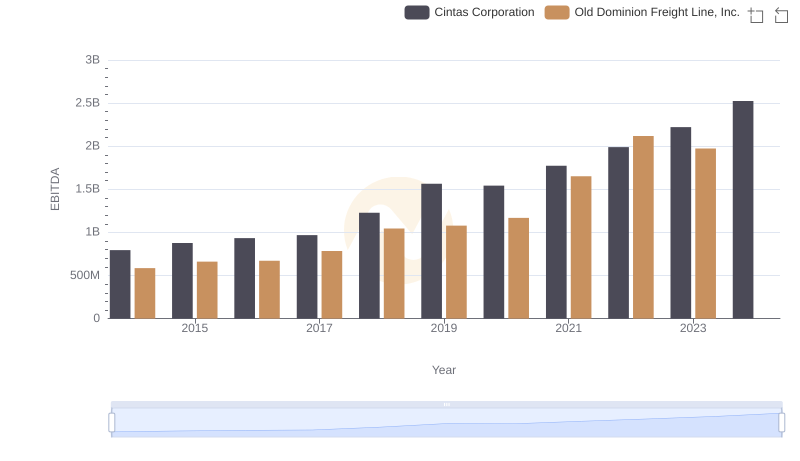
Professional EBITDA Benchmarking: Cintas Corporation vs Old Dominion Freight Line, Inc.
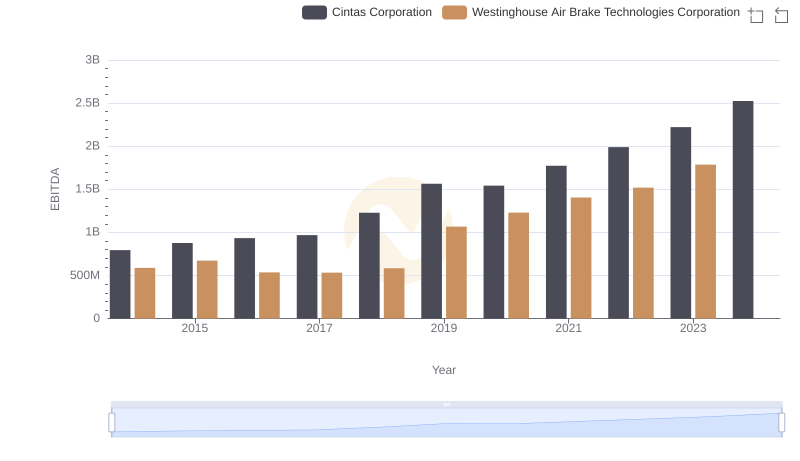
Comprehensive EBITDA Comparison: Cintas Corporation vs Westinghouse Air Brake Technologies Corporation
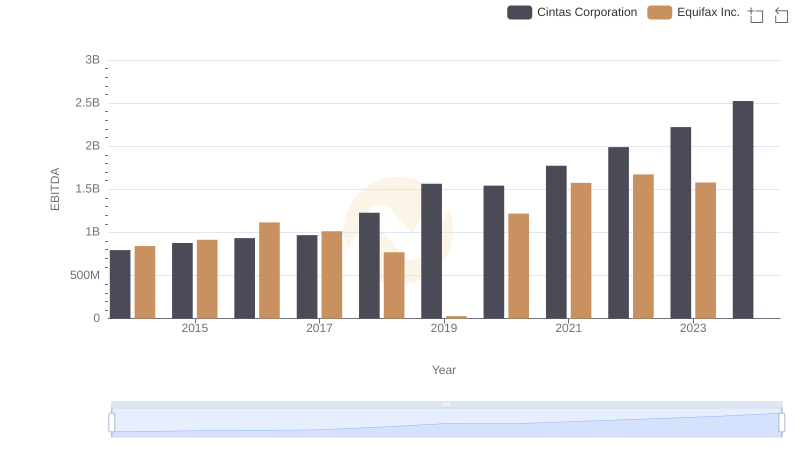
A Professional Review of EBITDA: Cintas Corporation Compared to Equifax Inc.
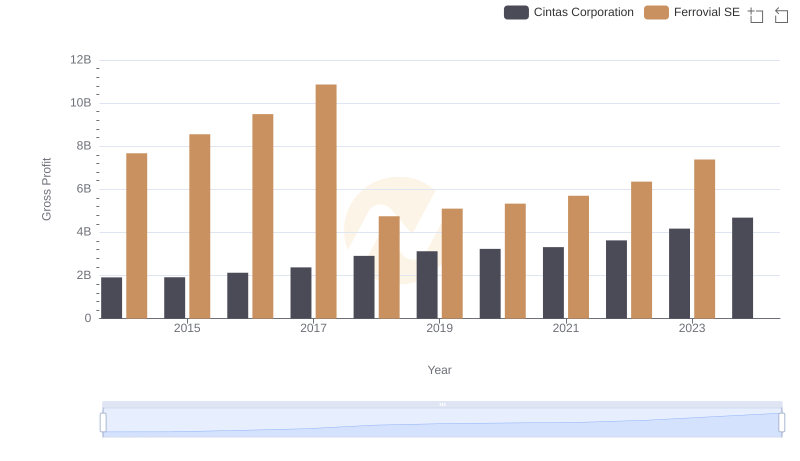
Key Insights on Gross Profit: Cintas Corporation vs Ferrovial SE
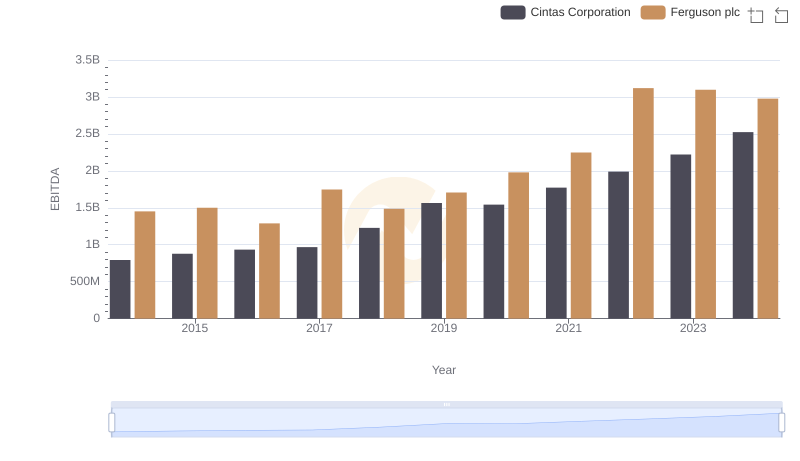
A Professional Review of EBITDA: Cintas Corporation Compared to Ferguson plc
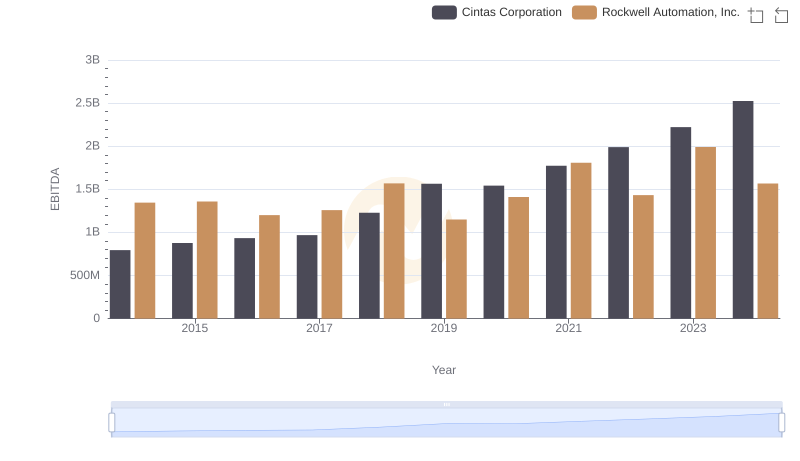
A Side-by-Side Analysis of EBITDA: Cintas Corporation and Rockwell Automation, Inc.
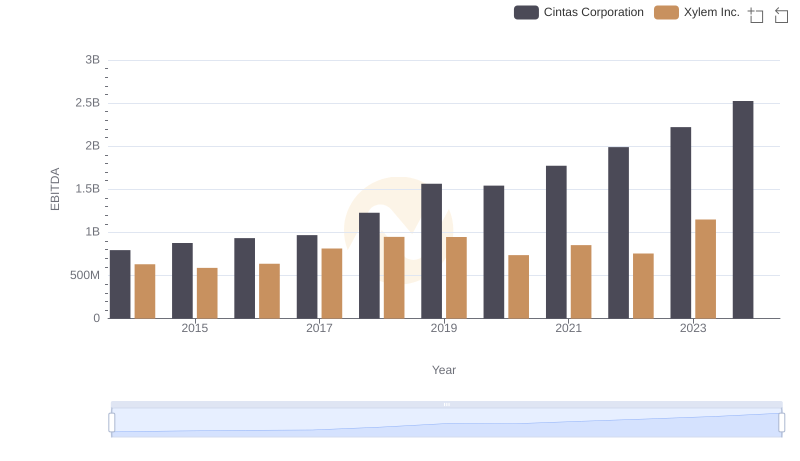
Professional EBITDA Benchmarking: Cintas Corporation vs Xylem Inc.
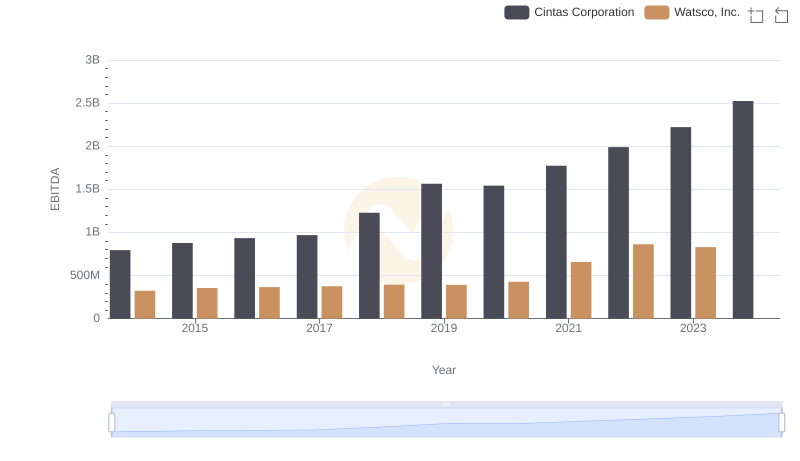
Cintas Corporation and Watsco, Inc.: A Detailed Examination of EBITDA Performance