| __timestamp | Cintas Corporation | Rockwell Automation, Inc. |
|---|---|---|
| Wednesday, January 1, 2014 | 793811000 | 1346000000 |
| Thursday, January 1, 2015 | 877761000 | 1359100000 |
| Friday, January 1, 2016 | 933728000 | 1200700000 |
| Sunday, January 1, 2017 | 968293000 | 1258400000 |
| Monday, January 1, 2018 | 1227852000 | 1568400000 |
| Tuesday, January 1, 2019 | 1564228000 | 1150200000 |
| Wednesday, January 1, 2020 | 1542737000 | 1410200000 |
| Friday, January 1, 2021 | 1773591000 | 1808300000 |
| Saturday, January 1, 2022 | 1990046000 | 1432100000 |
| Sunday, January 1, 2023 | 2221676000 | 1990700000 |
| Monday, January 1, 2024 | 2523857000 | 1567500000 |
Infusing magic into the data realm
In the ever-evolving landscape of industrial giants, Cintas Corporation and Rockwell Automation, Inc. have showcased remarkable financial trajectories over the past decade. From 2014 to 2024, both companies have demonstrated resilience and growth in their EBITDA, a key indicator of financial health and operational efficiency.
Cintas Corporation has seen a staggering increase of over 200% in its EBITDA, starting from approximately $794 million in 2014 to an impressive $2.52 billion in 2024. This growth reflects Cintas's strategic expansions and operational efficiencies.
Meanwhile, Rockwell Automation, Inc. has also experienced a robust growth trajectory, with its EBITDA peaking at nearly $1.99 billion in 2023, marking a 48% increase from its 2014 figures. Despite a slight dip in 2024, Rockwell's focus on automation and innovation continues to drive its financial success.
This side-by-side analysis highlights the dynamic nature of these industry leaders, offering insights into their strategic maneuvers and market adaptability.
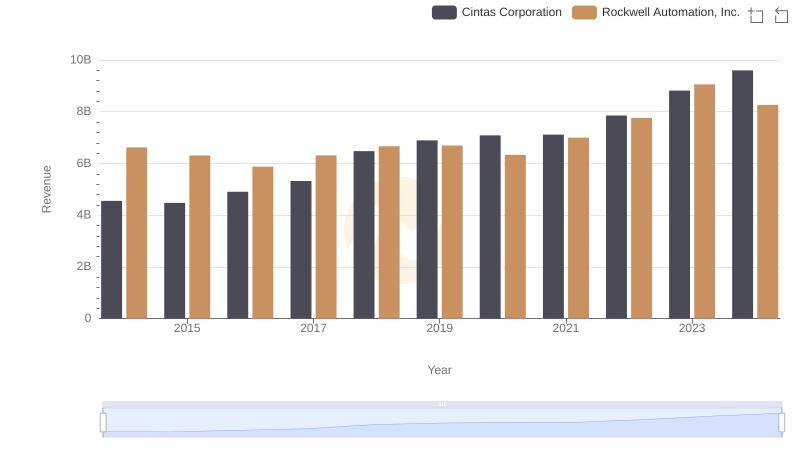
Who Generates More Revenue? Cintas Corporation or Rockwell Automation, Inc.
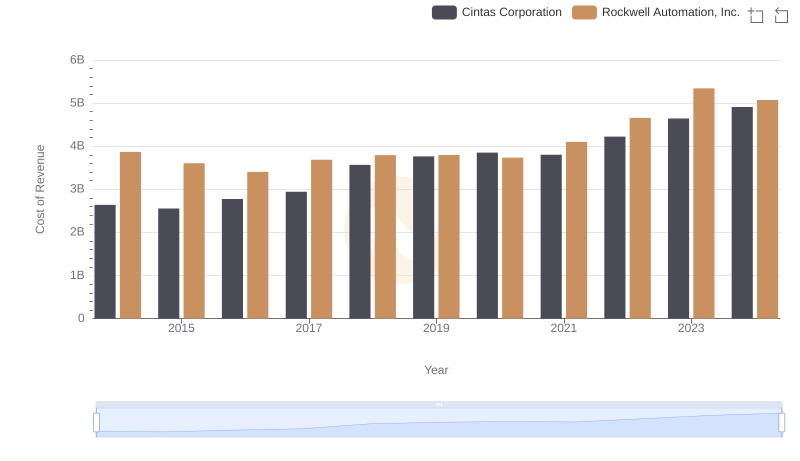
Cost of Revenue Comparison: Cintas Corporation vs Rockwell Automation, Inc.
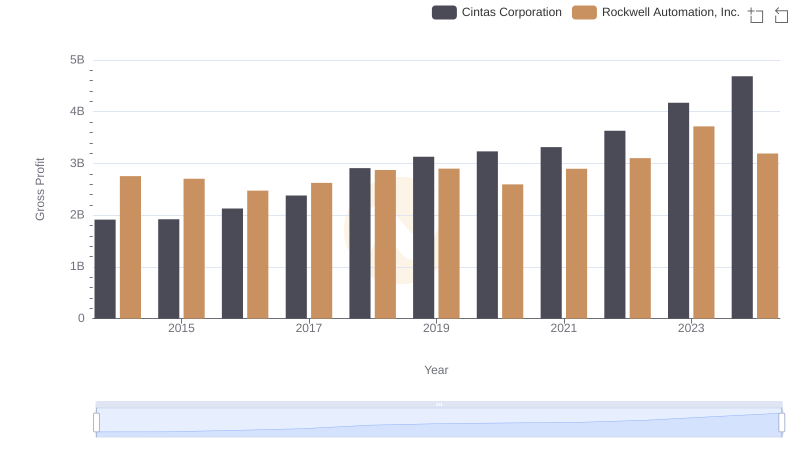
Who Generates Higher Gross Profit? Cintas Corporation or Rockwell Automation, Inc.
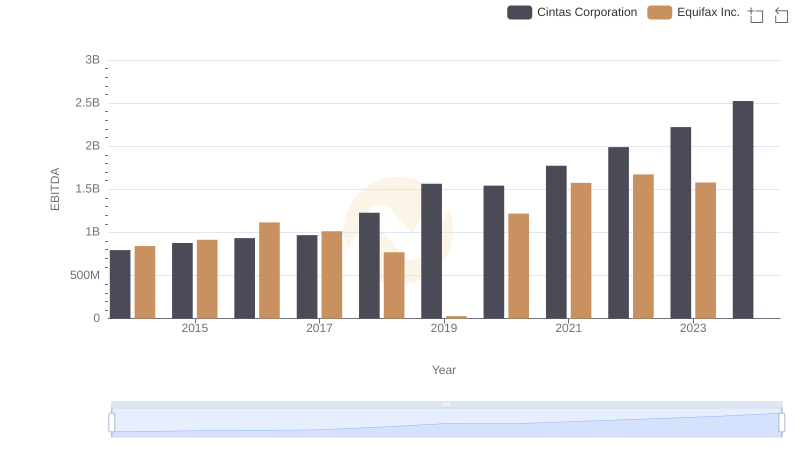
A Professional Review of EBITDA: Cintas Corporation Compared to Equifax Inc.
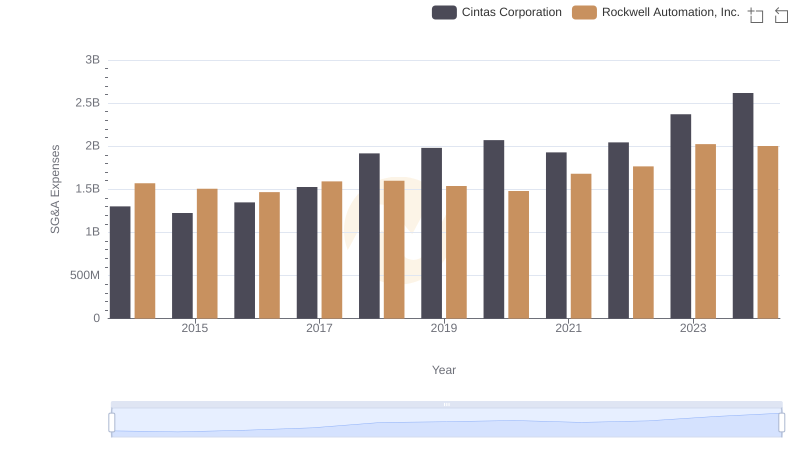
Comparing SG&A Expenses: Cintas Corporation vs Rockwell Automation, Inc. Trends and Insights
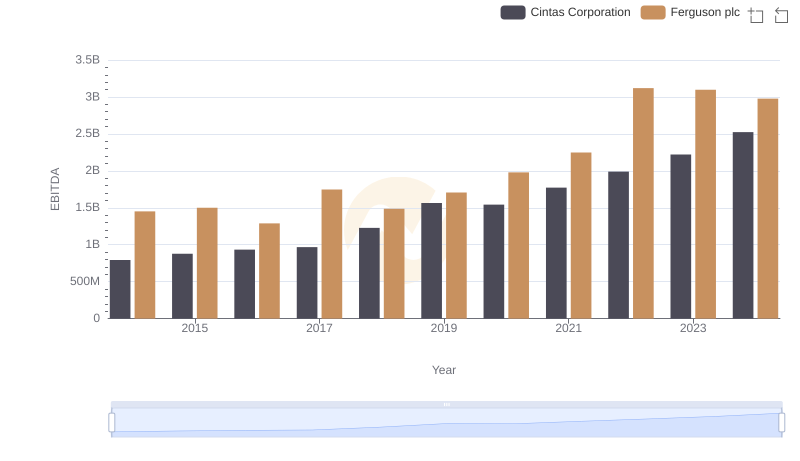
A Professional Review of EBITDA: Cintas Corporation Compared to Ferguson plc
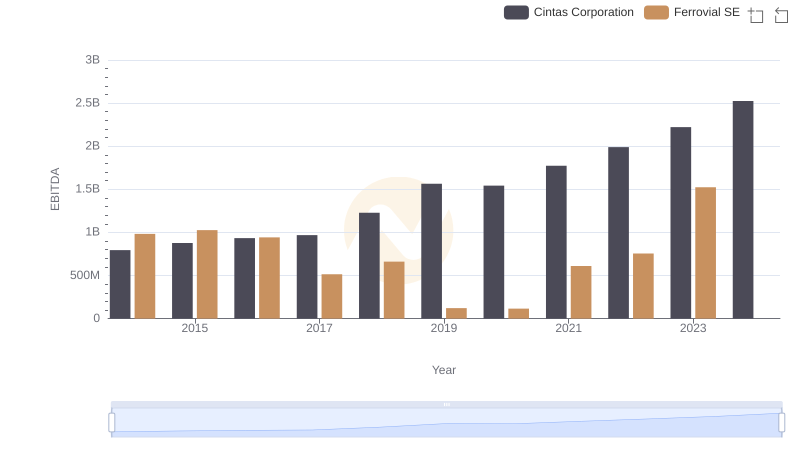
Comparative EBITDA Analysis: Cintas Corporation vs Ferrovial SE
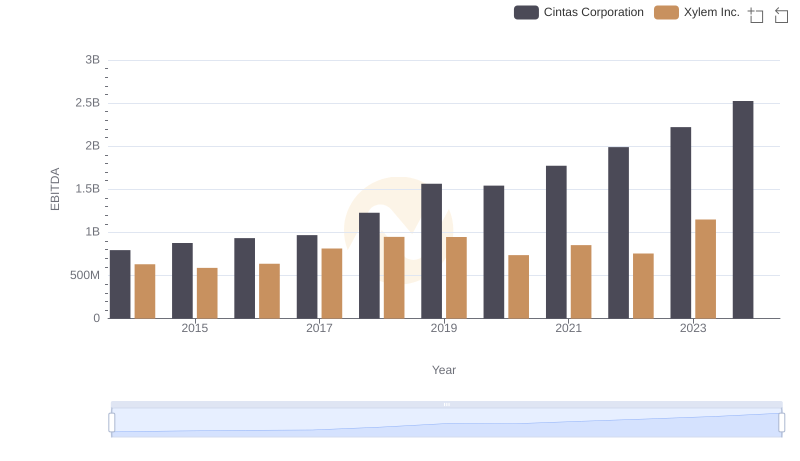
Professional EBITDA Benchmarking: Cintas Corporation vs Xylem Inc.
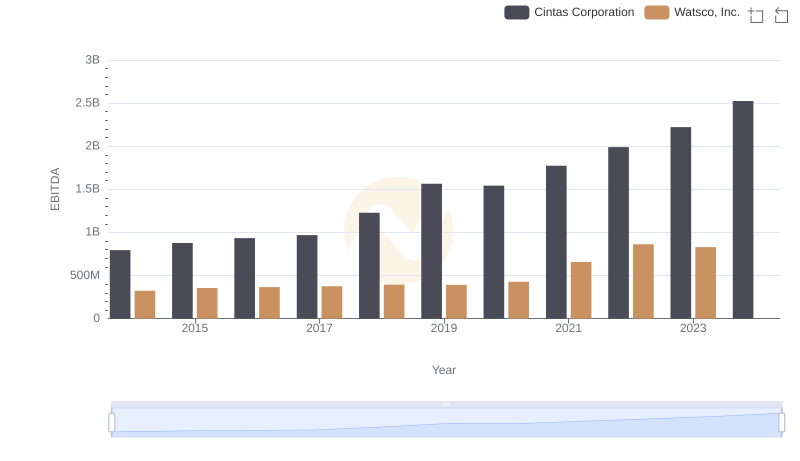
Cintas Corporation and Watsco, Inc.: A Detailed Examination of EBITDA Performance
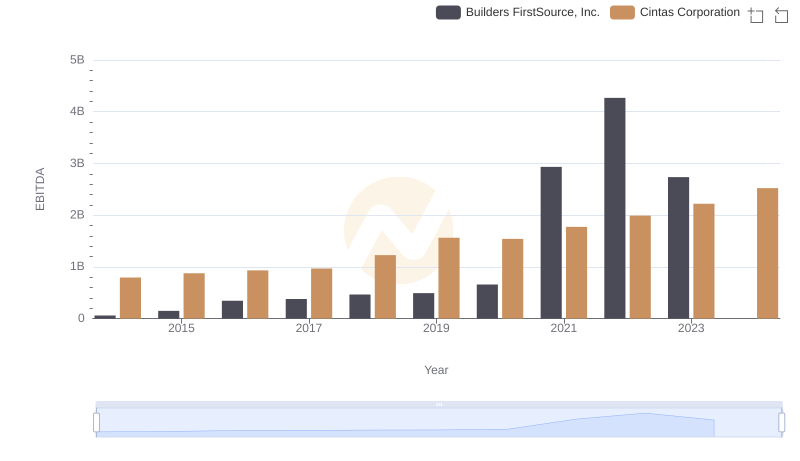
A Side-by-Side Analysis of EBITDA: Cintas Corporation and Builders FirstSource, Inc.
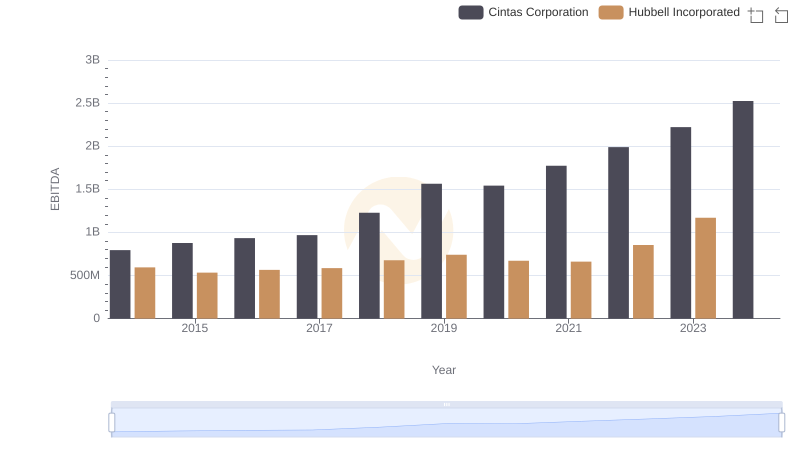
EBITDA Metrics Evaluated: Cintas Corporation vs Hubbell Incorporated
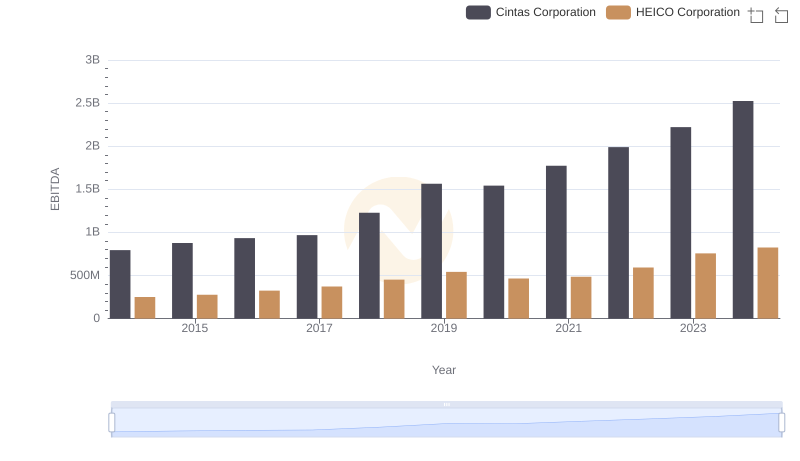
A Professional Review of EBITDA: Cintas Corporation Compared to HEICO Corporation