| __timestamp | Cisco Systems, Inc. | Fiserv, Inc. |
|---|---|---|
| Wednesday, January 1, 2014 | 19373000000 | 2881000000 |
| Thursday, January 1, 2015 | 19480000000 | 2909000000 |
| Friday, January 1, 2016 | 18287000000 | 2959000000 |
| Sunday, January 1, 2017 | 17781000000 | 3024000000 |
| Monday, January 1, 2018 | 18724000000 | 3069000000 |
| Tuesday, January 1, 2019 | 19238000000 | 5309000000 |
| Wednesday, January 1, 2020 | 17618000000 | 7812000000 |
| Friday, January 1, 2021 | 17924000000 | 8128000000 |
| Saturday, January 1, 2022 | 19309000000 | 7992000000 |
| Sunday, January 1, 2023 | 21245000000 | 7670000000 |
| Monday, January 1, 2024 | 18975000000 | 0 |
Infusing magic into the data realm
In the ever-evolving tech landscape, Cisco Systems, Inc. and Fiserv, Inc. have been pivotal players. From 2014 to 2023, Cisco's cost of revenue has shown a steady trend, peaking in 2023 with a 10% increase from 2014. Meanwhile, Fiserv's cost of revenue surged by nearly 170% from 2014 to 2021, reflecting its aggressive expansion strategy. However, 2023 saw a slight dip, indicating potential strategic shifts or market challenges. Notably, 2024 data for Fiserv is missing, leaving room for speculation. This comparison highlights the contrasting growth trajectories and strategic priorities of these industry leaders. As Cisco continues to optimize its operations, Fiserv's dynamic growth underscores its adaptability in a competitive market. Stay tuned as these giants navigate the complexities of the digital age.
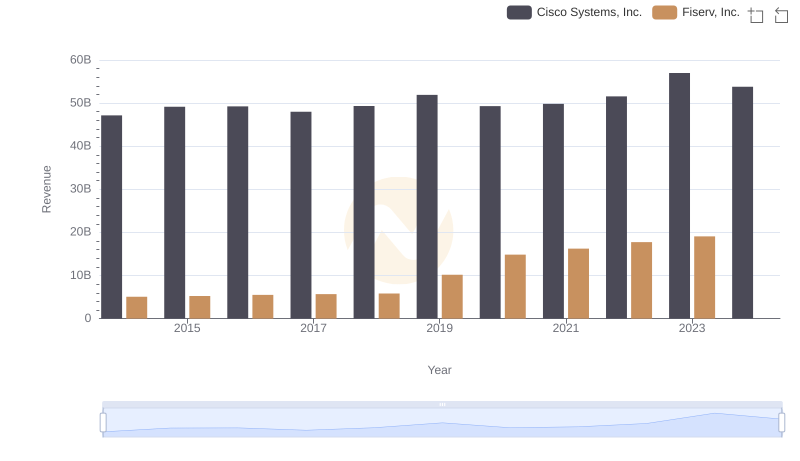
Comparing Revenue Performance: Cisco Systems, Inc. or Fiserv, Inc.?

Revenue Insights: Cisco Systems, Inc. and Fiserv, Inc. Performance Compared
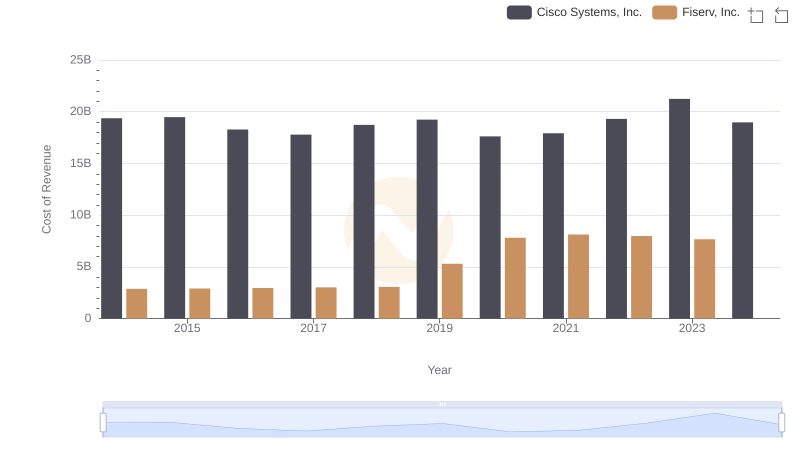
Analyzing Cost of Revenue: Cisco Systems, Inc. and Fiserv, Inc.
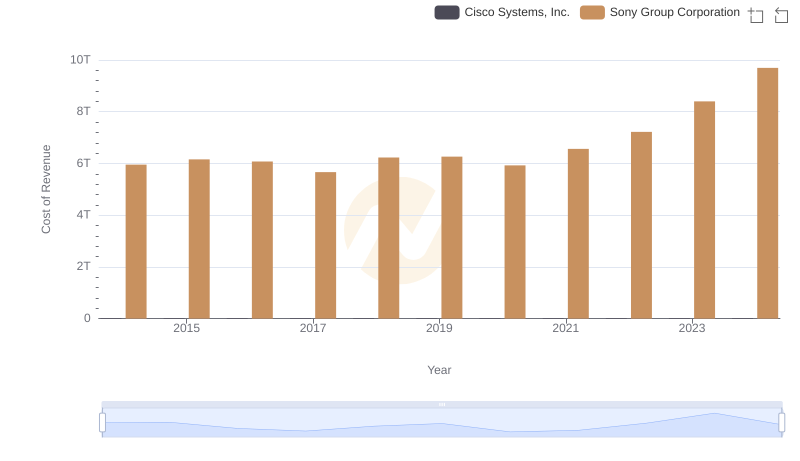
Cisco Systems, Inc. vs Sony Group Corporation: Efficiency in Cost of Revenue Explored

Cost of Revenue Trends: Cisco Systems, Inc. vs Palo Alto Networks, Inc.
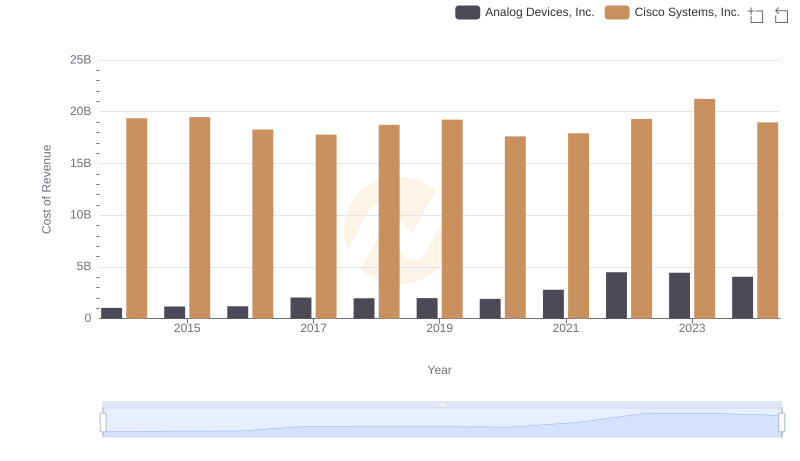
Comparing Cost of Revenue Efficiency: Cisco Systems, Inc. vs Analog Devices, Inc.

Key Insights on Gross Profit: Cisco Systems, Inc. vs Fiserv, Inc.
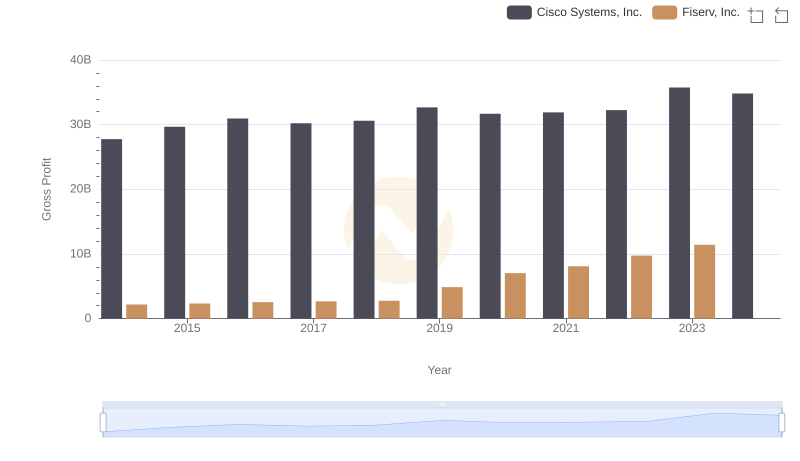
Key Insights on Gross Profit: Cisco Systems, Inc. vs Fiserv, Inc.
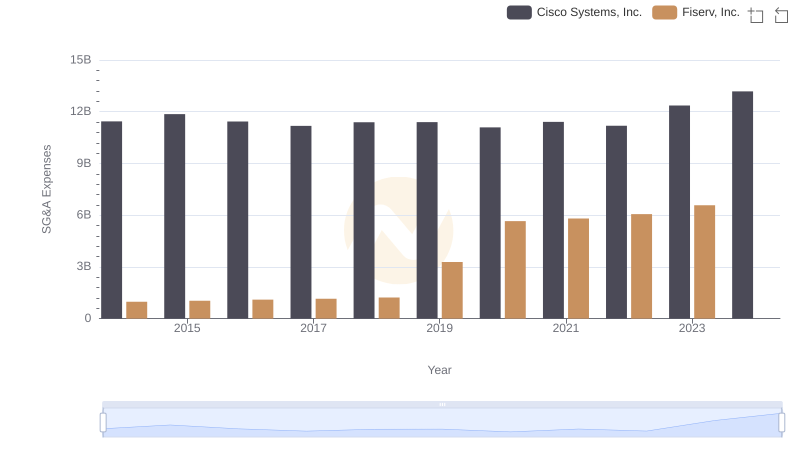
SG&A Efficiency Analysis: Comparing Cisco Systems, Inc. and Fiserv, Inc.
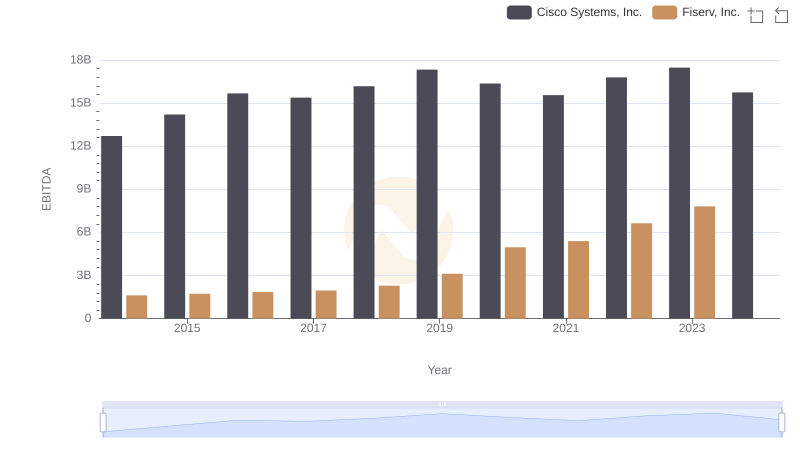
EBITDA Analysis: Evaluating Cisco Systems, Inc. Against Fiserv, Inc.

Comparing SG&A Expenses: Cisco Systems, Inc. vs Fiserv, Inc. Trends and Insights

A Professional Review of EBITDA: Cisco Systems, Inc. Compared to Fiserv, Inc.