| __timestamp | Cisco Systems, Inc. | Sony Group Corporation |
|---|---|---|
| Wednesday, January 1, 2014 | 47142000000 | 7767266000000 |
| Thursday, January 1, 2015 | 49161000000 | 8215880000000 |
| Friday, January 1, 2016 | 49247000000 | 8105712000000 |
| Sunday, January 1, 2017 | 48005000000 | 7603250000000 |
| Monday, January 1, 2018 | 49330000000 | 8543982000000 |
| Tuesday, January 1, 2019 | 51904000000 | 8665687000000 |
| Wednesday, January 1, 2020 | 49301000000 | 8259885000000 |
| Friday, January 1, 2021 | 49818000000 | 8999360000000 |
| Saturday, January 1, 2022 | 51557000000 | 9921513000000 |
| Sunday, January 1, 2023 | 56998000000 | 11539837000000 |
| Monday, January 1, 2024 | 53803000000 | 13020768000000 |
Unleashing insights
In the ever-evolving landscape of global technology and entertainment, Cisco Systems, Inc. and Sony Group Corporation stand as titans, each carving its own path. From 2014 to 2024, Cisco's revenue has shown a steady climb, peaking in 2023 with a 21% increase from its 2014 figures. Meanwhile, Sony's revenue trajectory is even more impressive, with a staggering 67% growth over the same period, reflecting its robust expansion in the entertainment and electronics sectors.
Cisco's revenue growth, though consistent, highlights its strategic focus on networking and cybersecurity, while Sony's surge underscores its dominance in gaming and entertainment. As we look to the future, these trends offer a glimpse into the strategic priorities and market dynamics shaping these industry leaders. The data reveals not just numbers, but a narrative of innovation and adaptation in a competitive global market.
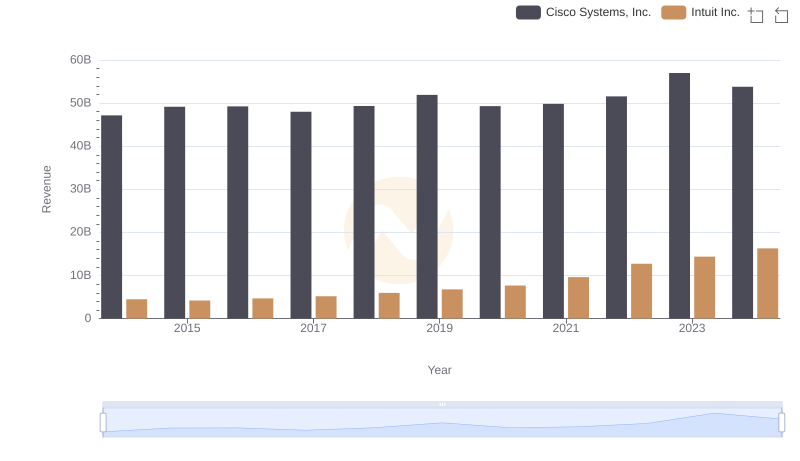
Revenue Showdown: Cisco Systems, Inc. vs Intuit Inc.
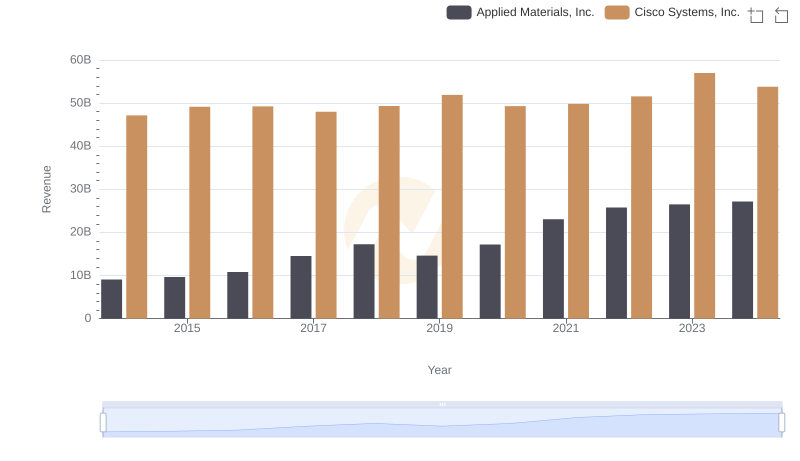
Cisco Systems, Inc. vs Applied Materials, Inc.: Annual Revenue Growth Compared
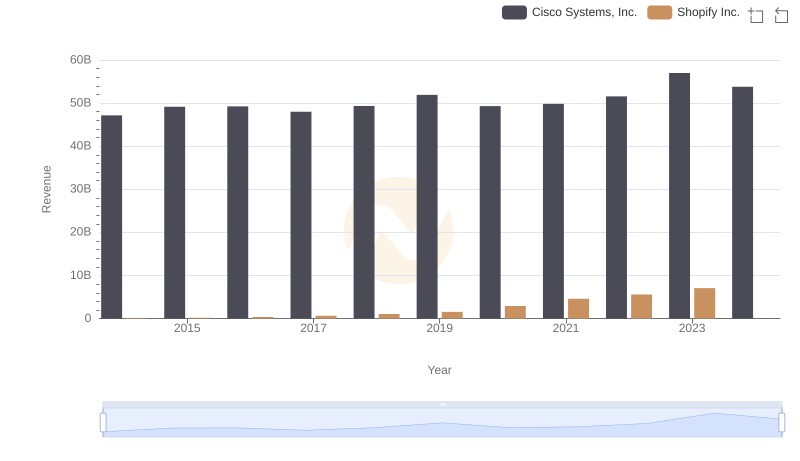
Cisco Systems, Inc. vs Shopify Inc.: Examining Key Revenue Metrics
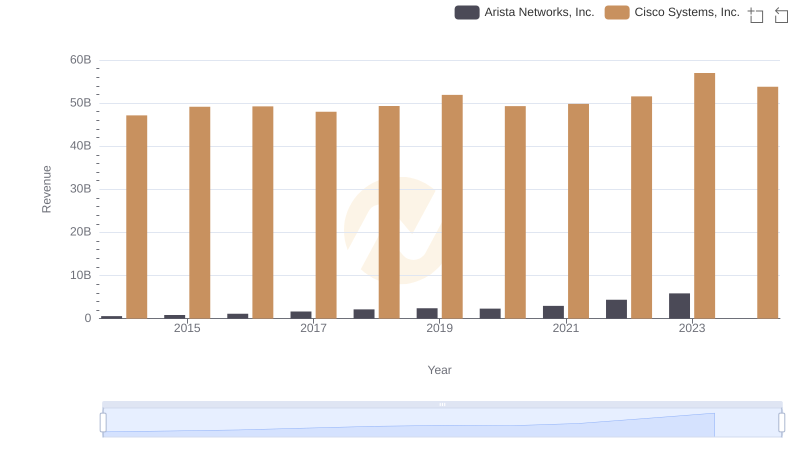
Comparing Revenue Performance: Cisco Systems, Inc. or Arista Networks, Inc.?
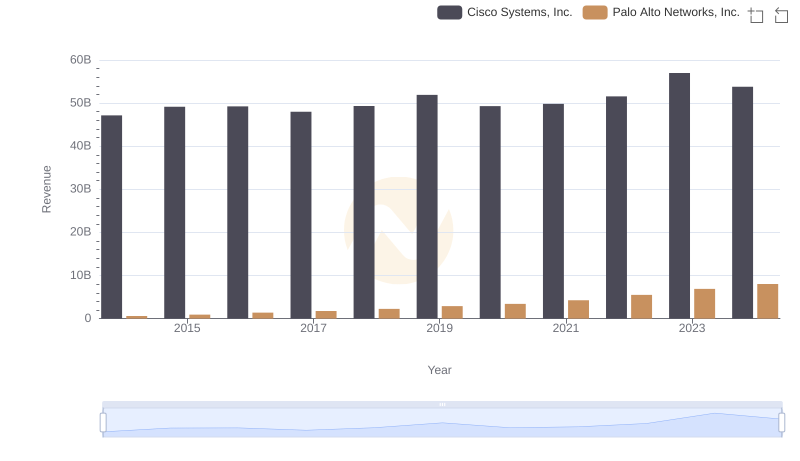
Revenue Showdown: Cisco Systems, Inc. vs Palo Alto Networks, Inc.
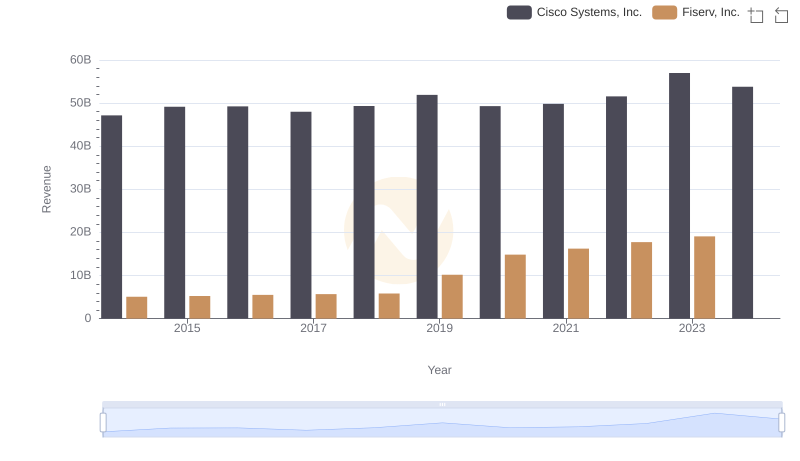
Comparing Revenue Performance: Cisco Systems, Inc. or Fiserv, Inc.?

Revenue Insights: Cisco Systems, Inc. and Fiserv, Inc. Performance Compared
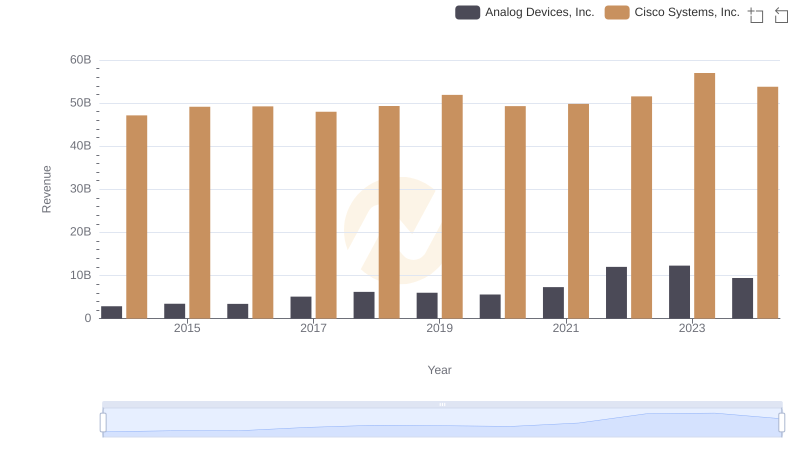
Cisco Systems, Inc. and Analog Devices, Inc.: A Comprehensive Revenue Analysis
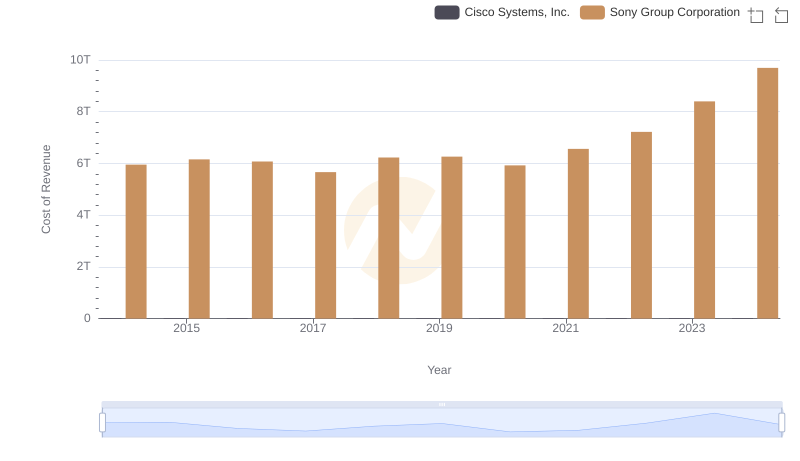
Cisco Systems, Inc. vs Sony Group Corporation: Efficiency in Cost of Revenue Explored
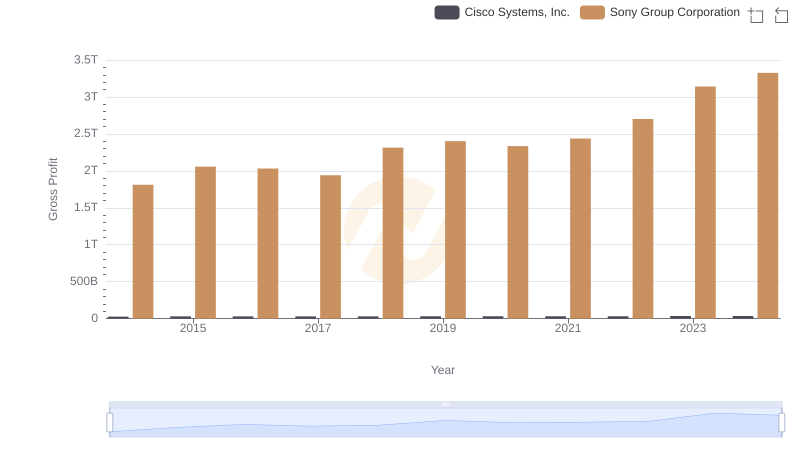
Who Generates Higher Gross Profit? Cisco Systems, Inc. or Sony Group Corporation
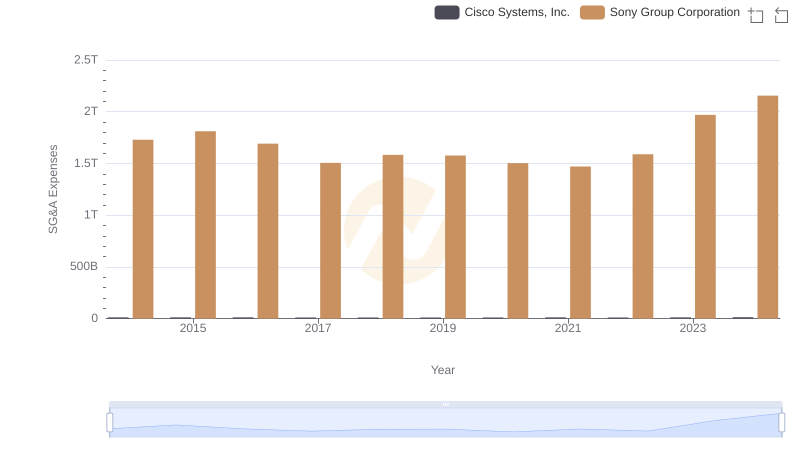
Comparing SG&A Expenses: Cisco Systems, Inc. vs Sony Group Corporation Trends and Insights
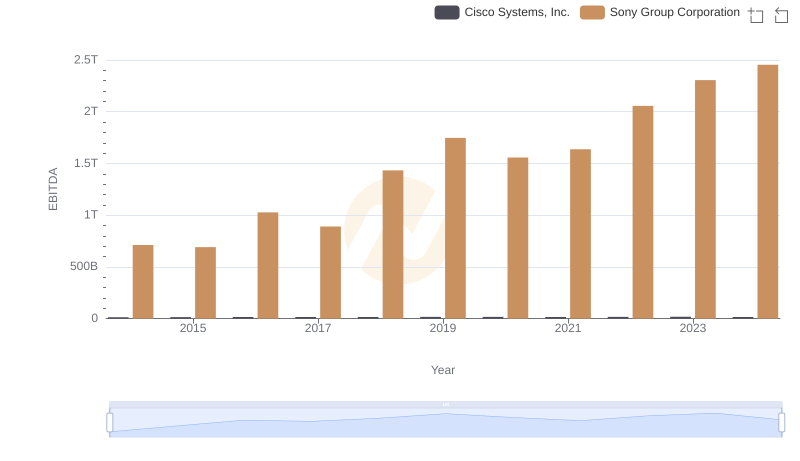
Comparative EBITDA Analysis: Cisco Systems, Inc. vs Sony Group Corporation